
Maximum Favorable Excursion: Optimise Your Exits
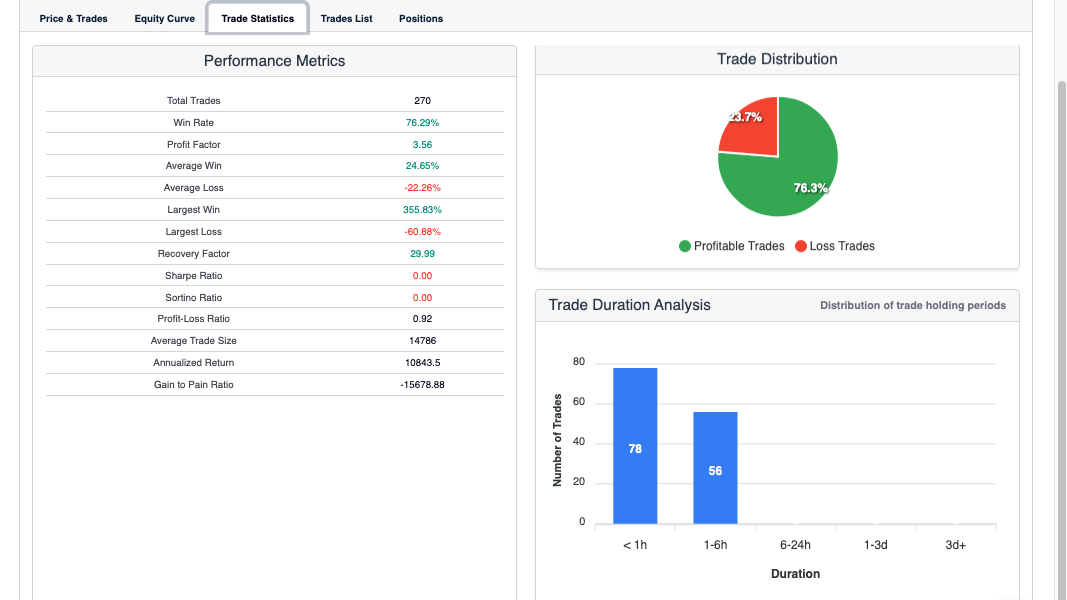
Maximum favorable excursion (MFE) is the backtest metric that reveals how much profit was available on every trade at its peak — not what you captured, but what was on the table. Understanding MFE is one of the most direct paths to improving take-profit placement in a systematic strategy.
What Is Maximum Favorable Excursion?
Maximum favorable excursion measures the highest unrealised profit point a trade reaches during its lifetime. It is calculated from the entry price to the highest price point while the position was open, expressed as a percentage or absolute price distance.
A simple example: a trade opens at $100, peaks at $112 during its life, then closes at $107. The MFE is 12%. The actual captured return is 7%. The 5% gap is profit that was available but not taken.
Every trade in a backtest has an MFE value. Viewed as a distribution across all historical trades, MFE reveals a consistent pattern: how far your strategy’s entries typically move in your favour before reversing or closing.
Why MFE Is the Missing Piece in Exit Design
Most traders set take-profit levels based on intuition, round numbers, or a target risk-reward ratio — without checking whether their historical trades actually reach those levels. MFE makes the gap between assumption and reality visible.
If your take-profit is at +10% but the average MFE across your backtest is +6%, most trades never reach the exit. You are waiting for a move that rarely materialises. Lowering the target to +5% would capture more winners and improve the overall result.
The reverse is equally common: a take-profit at +4% when average MFE is +11% means you are consistently capping trades that had much further to run. You are locking in a fraction of the return each setup produced.
Neither problem is visible from win rate or Sharpe ratio alone. MFE is the specific tool that surfaces the mismatch between exit logic and actual strategy behaviour.
How to Read Your MFE Distribution
When reviewing MFE data from a backtest, focus on three figures:
Average MFE: The mean peak profit across all trades. Compare directly to your take-profit level. If average MFE is significantly above your target, you have room to raise it. If it is below, the target is too ambitious.
Median MFE: The midpoint value when all MFE readings are ranked in order. Useful when a small number of large outliers pull the average up. The median gives a clearer picture of what a typical trade actually reaches at its peak.
MFE percentiles: What percentage of trades reach +5%? +8%? +12%? This distribution tells you the probability of any given take-profit level being hit. If only 25% of trades reach your target, you need to decide whether the size of those wins justifies the 75% that close below it.
How MFE and MAE Work Together
MFE and Maximum Adverse Excursion (MAE) are complementary measures of trade behaviour. MAE measures how far a trade moves against you before recovering — the data that informs stop-loss placement. MFE measures how far it moves in your favour — the data that informs take-profit placement.
Used together, they give you a data-driven framework for both sides of the exit decision:
- Set your stop loss just beyond the typical MAE — outside normal price noise
- Set your take-profit at a level reached by a meaningful proportion of trades, based on MFE distribution
This replaces guesswork with evidence drawn directly from the strategy’s own historical behaviour. It is one of the most practical steps a systematic trader can take toward improving live performance.
How to Apply MFE Analysis in Arrow Algo
Arrow Algo’s backtest results provide individual trade data for every strategy run. Use this to build your MFE distribution:
Run a backtest on your scenario and review the trade breakdown. For each closed trade, note the peak unrealised profit — this is the MFE for that trade. Aggregate these values across all trades to see the full distribution.
Compare the pattern against your current take-profit setting. If 70% of trades peak below your target level, bring it down. If 80% of trades peak above your current exit, consider raising it to let winners run further.
Adjust the take-profit parameter on your exit block in the Arrow Algo visual builder, re-run the backtest, and compare results. The same logic applies to trailing stops: check what proportion of average MFE your trailing stop captures and adjust the trail distance accordingly.
No code is required at any stage. Every parameter is set directly through the Arrow Algo visual block interface.
Key Takeaways
- Maximum favorable excursion (MFE) is the highest unrealised profit point a trade reaches before closing
- It reveals whether take-profit levels are calibrated to what the strategy actually produces
- Average and median MFE show whether your targets are too ambitious or too conservative
- MFE percentile data shows the probability that any given take-profit level will be hit
- Pair MFE with MAE to build a data-driven framework for both stop and take-profit placement
- Analyse MFE trade-by-trade in Arrow Algo’s backtest results and adjust exit blocks — no code required
Disclaimer: This content is for educational purposes only and does not constitute financial advice. Trading involves significant risk and you should only trade with capital you can afford to lose. Past performance is not indicative of future results. Always conduct your own research before making any trading decisions.
Ready to build your own automated trading strategies without writing a single line of code? Start for free at Arrow Algo and join thousands of traders who’ve made the switch to systematic trading.