
Price Momentum Indicator Strategy: How to Build It in Arrow Algo
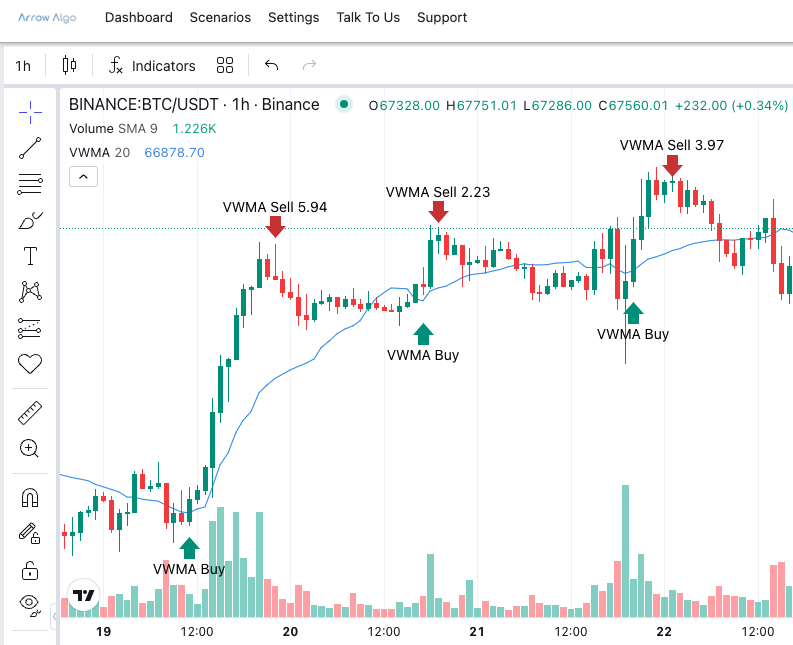
A momentum indicator strategy starts from the simplest calculation in technical analysis. Take today’s close. Subtract the close from ten candles ago. That is the whole indicator. No smoothing, no bounds, no ratio. Its plainness is why many traders skip it for RSI or MACD. It is also why it tests cleanly. There is nothing hidden inside to overfit. This guide covers what the Momentum indicator (MOM) measures, three ways to trade it, and how to assemble each one with visual blocks.
What Does the Momentum Indicator Tell You?
The Momentum indicator reports the raw distance price has travelled over a fixed window. A 10-period momentum of +400 on Bitcoin means price is $400 higher than it was ten candles ago. A reading of -400 means it is $400 lower. Zero means price is exactly where it started.
That is a different question from most oscillators. RSI asks how one-sided recent gains have been. MACD asks how two averages are diverging. Momentum asks how far, and in which direction. StockCharts groups it with Rate of Change for this reason. ROC expresses the same distance as a percentage. Momentum expresses it in price units.
The line crosses zero whenever price crosses its own value from N periods ago. A rising line means the move is accelerating. A falling line that is still above zero means price is still up over the window. It is just up by less each candle. That last state is the one most traders misread.
Why Raw Momentum Is Not Comparable Across Markets
The indicator’s units are its biggest trap. A momentum of +400 is a large move on a $20,000 asset. On a $86,000 asset it is noise. The same number means different things on the same asset two years apart.
This rules out fixed thresholds that travel between markets. A rule like “buy when momentum exceeds 500” is a Bitcoin-at-one-price rule. Move it to Ethereum and it never fires. Move it to Bitcoin after a doubling and it fires constantly.
There are two fixes. The first is to use only the zero line, which is unit-free by definition. The second is to divide momentum by a volatility measure such as ATR. That turns “$400 in ten candles” into “1.3 ATRs in ten candles”. A reading in ATR units means the same thing on every pair and in every year. Both approaches appear in the strategies below.
Three Momentum Indicator Strategies Worth Testing
Each of these is a complete rule set. Test them separately before combining anything.
Zero-line cross with a regime filter
Go long when momentum crosses above zero and price is above a 200-period EMA. Exit when momentum crosses back below zero. The EMA filter keeps the strategy out of bear-market bounces. The zero cross is a lagging but honest signal. It fires only after price has recovered its level from N candles ago.
This version trades often on short lookbacks and rarely on long ones. A 10-period setting on 4-hour candles gives a few signals a week on a major pair. A 50-period setting gives a few a month.
ATR-normalised threshold entry
Divide momentum by a 14-period ATR. Go long when the ratio exceeds a chosen level, such as 1.5. That means price has moved more than one and a half average ranges over the lookback. Exit when the ratio falls below 0.5.
This setup enters later than the zero cross but filters weak moves. Sideways drift that happens to be above zero does not qualify. The threshold travels between pairs without retuning, which makes multi-pair testing straightforward.
Momentum fade as an exit
Use any trend entry you like. Exit when momentum makes a lower high while price makes a higher high. That divergence means the move is still going but losing pace. It often precedes the top by several candles.
This is the hardest of the three to define precisely. A workable version compares the current momentum peak against the highest momentum reading over the last 20 candles. If price is at a 20-candle high and momentum is not, the exit fires. It will leave some profit on the table in a strong trend. It will also get you out before the full reversal in most others.
Choosing the Lookback Period
The lookback is the only parameter. Shorter windows react faster and whipsaw more. Longer windows lag more and hold through pullbacks. There is no correct value. There is a value that matches the holding period you want.
A useful starting point is to match the lookback to your average trade length. If backtests show winners run for roughly 15 candles, a 10 to 14 period momentum will track those trades. A 50-period momentum will still be positive long after the move has ended.
Test a range rather than a point. If 10, 12 and 14 all produce a similar equity curve, the strategy is robust around that region. If only 12 works and 11 and 13 both lose, the result is an artefact. Our guide to parameter optimisation covers how to read those neighbourhood tests.
Errors That Break a Momentum Indicator Strategy
Treating the zero cross as a reversal. Momentum crossing below zero means price is lower than N candles ago. It does not mean the trend has reversed. In a choppy range the line crosses zero constantly. The regime filter exists to handle this.
Comparing readings across time. A momentum of +2,000 on Bitcoin in 2023 is a different event from +2,000 in 2026. Any threshold rule needs the ATR normalisation or it will drift as price levels change.
Using the same lookback for entry and exit. Entries often want a faster window than exits. Entering on a 10-period cross and exiting on a 20-period cross gives trades room to breathe. Test the pair, not just the entry.
Ignoring the cost of the lag. Momentum confirms a move after it has happened. By the zero cross, a meaningful part of the move is already done. That is fine if the strategy is designed to ride the middle of trends. It is a problem if the backtest assumes it is catching turns.
How to Build a Momentum Indicator Strategy in Arrow Algo
Pick one exchange, one pair and one timeframe. Work from completed candles so signals do not repaint.
For the zero-line version:
- Measure momentum. Feed closing prices into a Momentum block with a 10-period setting.
- Define the regime. Add a 200-period EMA block on the same closes.
- Catch the trigger. Use a Crossover block to detect momentum crossing above a fixed zero value.
- Combine the conditions. Use a Condition block set to AND. Inputs: the crossover fired, close is above the EMA, no open position.
- Wire the exit. A second Crossover block in the opposite direction catches momentum falling through zero.
For the ATR-normalised version, add an ATR block and a divide block. Feed momentum and ATR into the divide block. Compare the output against a fixed number block set to your threshold. The rest of the layout stays identical.
For the fade exit, add a Max block over 20 periods to both price and momentum. A Condition block checks that close equals its 20-period max while momentum sits below its own. That condition becomes the exit.
Attach a protective stop in every version. A stop one ATR below the entry candle’s low is a reasonable default. Record it at entry and leave it alone. Then backtest, run a walk-forward test, and compare the three versions on the same pair and period before picking one.
Key Points to Remember
- Momentum is close minus close N periods ago. Its simplicity is a feature for testing.
- The reading is in price units. Fixed thresholds do not travel between pairs or years.
- The zero line is unit-free. Dividing by ATR makes thresholds portable.
- Three testable setups: zero cross with regime filter, ATR-normalised threshold, momentum fade exit.
- Match the lookback to your intended holding period and test the neighbourhood around it.
- Momentum lags. Build the strategy to ride the middle of moves, not to catch turns.
Disclaimer: This content is for educational purposes only and does not constitute financial advice. Trading involves significant risk and you should only trade with capital you can afford to lose. Past performance is not indicative of future results. Always conduct your own research before making any trading decisions.
Ready to build your own automated trading strategies without writing a single line of code? Start for free at Arrow Algo and join thousands of traders who've made the switch to systematic trading.