
Open Interest Trading: What It Signals for Systematic Strategies
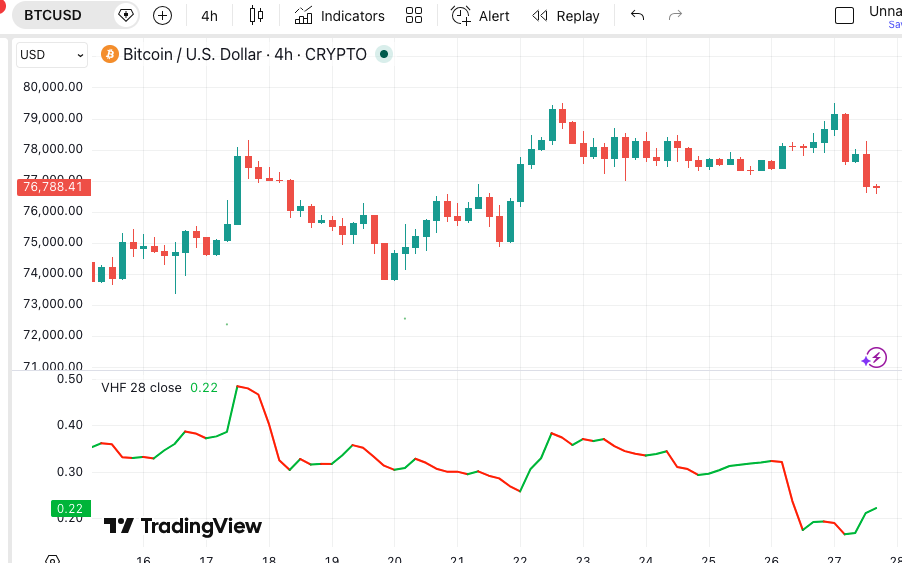
Open interest trading uses the total number of active positions in a derivatives market — particularly crypto perpetuals and futures — to gauge the strength, sustainability, and likely direction of price moves. Price alone tells you what is happening. Open interest tells you whether the conviction behind it is growing or fading.
What Is Open Interest in Crypto Trading?
Open interest (OI) is the total count of outstanding derivative contracts that have not yet been settled or closed. Each time a new long and a new short position are opened together, open interest increases by one contract. Each time a position is closed — by the holder taking the opposite side — open interest decreases by one.
Open interest is not the same as volume. Volume counts every transaction, including position closures. Open interest only counts positions that remain open. A spike in volume with falling OI suggests traders are closing positions, not opening new ones. A rise in both volume and OI suggests new capital is entering the market.
In crypto, open interest data is most commonly tracked across perpetual futures — the dominant derivative product on exchanges like Binance, Bybit, and HyperLiquid. Platforms like Coinglass aggregate OI across exchanges and make it available as a real-time feed. CoinMarketCap’s derivatives section also tracks OI alongside funding rates.
Why Open Interest Matters More Than Volume Alone
Volume is a backward-looking measure — it tells you what happened in a given period. Open interest is a current-state measure — it tells you how much committed capital is positioned right now.
This distinction matters for systematic traders. A price breakout on high volume but declining open interest suggests existing holders are exiting into the move. The breakout may lack the new-money conviction to sustain. A price breakout where both volume and open interest are rising simultaneously confirms that new participants are entering in the direction of the move — a stronger signal for trend-following strategies.
Open interest also reveals stress in the market. Very high OI relative to recent averages, especially concentrated on one side, creates the conditions for a squeeze. When price moves against the majority position and margin calls force liquidations, those closures accelerate the move and produce the sharp, fast moves that perpetual traders call “long squeezes” or “short squeezes.”
What Different OI Patterns Signal
Rising OI + rising price: New long positions are entering. Capital is flowing into the market in the direction of the trend. This is the strongest confirmation for trend-following long entries.
Rising OI + falling price: New short positions are entering. Capital is flowing into the market on the short side. Confirms a downtrend has conviction behind it — not just selling of existing longs.
Falling OI + rising price: Shorts are closing (covering), driving the price up. This is a short-squeeze dynamic. The move may be sharp but often lacks sustainability once the covering is complete. Trend-following systems should treat this pattern with caution.
Falling OI + falling price: Longs are closing (taking profit or cutting losses), driving the price down. This suggests a trend is exhausting rather than accelerating. A potential reversal or consolidation is more likely than a continuation.
OI spike at a key level: A sudden jump in open interest as price approaches a support or resistance level suggests one side is aggressively positioning. This often precedes a sharp move in either direction — the level becomes a squeeze trigger if price breaks through.
How to Use Open Interest in Systematic Strategies
OI trend confirmation filter: Before entering a trend-following trade, check whether open interest is rising in the direction of the move. Only take long signals when OI is also trending upward — confirming new money is entering, not just positioning reshuffling.
Squeeze detection: Monitor the ratio of longs to shorts in OI data (available on most derivatives dashboards). When one side is heavily dominant — over 60–70% of open positions — the market is vulnerable to a squeeze in the opposite direction. Systematic strategies can fade extreme skew as a contrarian signal.
OI as an exit trigger: When OI begins falling sharply while an existing position is profitable, it can signal that the trend is running out of participants. Using declining OI as an additional exit condition — alongside price-based stops — can improve the timing of trend exits. For related risk management approaches, see the guide to automated risk management.
Combining OI with funding rates: In crypto perpetuals, open interest and funding rates provide complementary signals. High OI with extreme positive funding (longs paying shorts heavily) signals an overcrowded long side — a squeeze risk. Low OI with extreme negative funding signals an overcrowded short side. See the crypto funding rates guide for the full breakdown.
What to Avoid When Reading Open Interest Data
Treating OI as a directional signal in isolation. Open interest tells you how much conviction is behind a move, not which direction the market will go next. Rising OI in a downtrend confirms the downtrend — it does not predict a reversal. Always read OI in the context of price direction, not against it.
Ignoring exchange concentration. OI aggregated across all exchanges can mask significant concentration on a single platform. If 70% of total BTC open interest sits on one exchange and that exchange’s OI changes sharply, it has more market impact than the same absolute change spread evenly. Where possible, look at per-exchange OI breakdown alongside the aggregate.
Confusing OI change with OI level. A high absolute OI level tells you the market is heavily positioned. A change in OI tells you something is happening right now. Both matter — but for timing entries and exits, the rate of change in OI is typically more actionable than the absolute level.
How to Apply Open Interest Logic in Arrow Algo
Arrow Algo connects directly to live exchange data including open interest feeds. You can incorporate OI as an input into your strategy logic through data blocks that pull the current OI value for your chosen trading pair.
To build a confirmation filter, connect an OI data block to a condition block checking whether OI is trending upward over a defined lookback window. Connect this condition to an AND gate alongside your primary entry signal. Entries only fire when your trend signal and the OI confirmation are both present simultaneously.
To build a squeeze monitor, connect OI and funding rate data blocks to condition blocks that check for extreme skew. When long-short ratio crosses a threshold (indicating overcrowding), trigger a contrarian entry block or an alert condition that pauses trend-following entries until the skew normalises.
All of this is configured visually — connecting blocks on a canvas without writing any code.
Key Takeaways
- Open interest measures total active positions in derivatives — rising OI confirms new capital is entering the market in the direction of the current move
- OI combined with price direction gives four distinct signals: trend confirmation (rising OI + price move), squeeze warning (OI spike against trend), exhaustion (falling OI + price move), and capitulation (falling OI + counter-trend move)
- Extreme long/short skew in OI signals squeeze risk — a common contrarian signal in systematic crypto strategies
- Pair OI with funding rates for a complete picture of derivatives market positioning
- Arrow Algo lets you build OI-filtered strategies visually using live exchange data — no code required
Disclaimer: This content is for educational purposes only and does not constitute financial advice. Trading involves significant risk and you should only trade with capital you can afford to lose. Past performance is not indicative of future results. Always conduct your own research before making any trading decisions.
Ready to build your own automated trading strategies without writing a single line of code? Start for free at Arrow Algo and join thousands of traders who’ve made the switch to systematic trading.