
Rolling Moving Average (RMA): Complete Guide for Algorithmic Trading
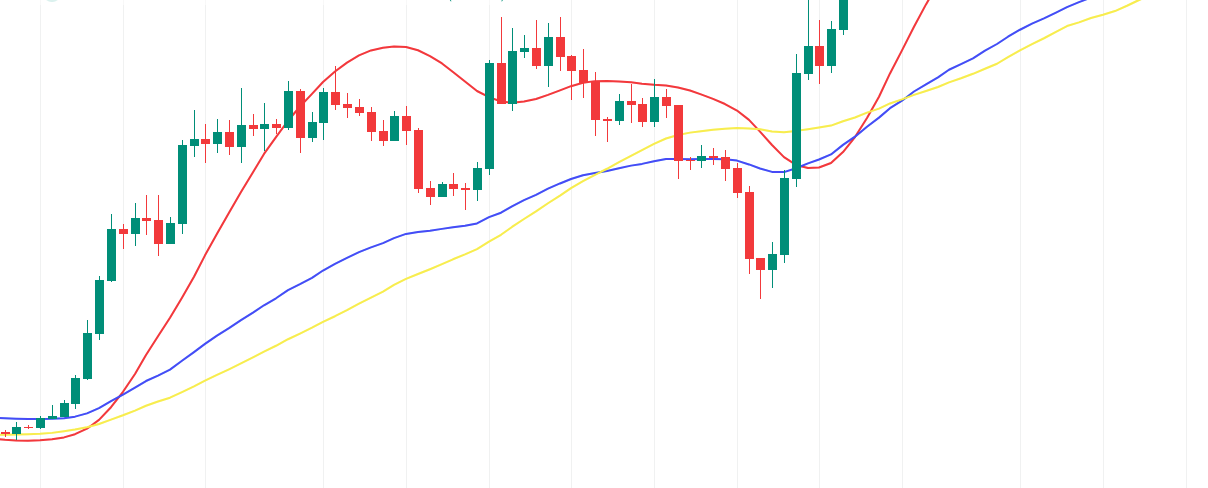
The Rolling Moving Average (RMA) is a smoothing technique that applies a gentler decay factor than the standard Exponential Moving Average — producing a slower, more stable line that tracks the underlying trend without being pulled around by short-term price swings. If you have used RSI, you have already seen the RMA at work: it is the smoothing method applied internally to calculate RSI’s average gains and losses.
What Is the Rolling Moving Average?
The Rolling Moving Average is an exponential smoothing function, sometimes called the Modified Moving Average or Wilder’s Moving Average after J. Welles Wilder, who built it into several of his most widely used indicators including RSI and ATR.
Like the standard EMA, the RMA assigns more weight to recent prices and less to older ones. Unlike the standard EMA, it does so more gradually. Each bar has slightly less influence on the RMA than it would on an EMA of the same period — making the RMA slower to respond to new information but also less reactive to short-term noise.
For most traders, the RMA sits in a useful middle ground: more responsive than a Simple Moving Average, more stable than a standard EMA. This makes it particularly effective as a baseline or filter in systematic strategies that need to track trend direction without overreacting to individual candles.
How Does RMA Differ from EMA and SMA?
The three moving averages differ primarily in how they weight historical price data.
The Simple Moving Average (SMA) weights every bar in its lookback period equally — the most recent bar and the oldest bar in the window have identical influence. This makes it easy to understand but slow to react and prone to sharp step-changes when old data drops out of the window.
The Exponential Moving Average (EMA) applies a smoothing factor of 2 ÷ (N + 1), where N is the period. This front-loads recent data significantly — a 14-period EMA gives the current bar roughly 13% of total weight. The EMA reacts quickly to new prices.
The Rolling Moving Average applies a smoothing factor of 1 ÷ N. For the same 14-period setting, this gives the current bar approximately 7% of total weight — roughly half the influence it would have in an equivalent EMA. As a result, an RMA with period N behaves similarly to an EMA with period (2N − 1). A 14-period RMA is approximately as smooth as a 27-period EMA.
The practical effect: RMA lines are smoother and lag more than same-period EMA lines. In trending markets, this is a feature — the RMA stays on the right side of the trend longer and generates fewer false crossovers. In fast-moving or reversing markets, that same lag is a cost.
When Does the Rolling Moving Average Outperform?
Trend-following strategies: Because the RMA smooths out noise more aggressively than EMA, RMA crossovers generate fewer signals — most of which occur when a genuine trend is in place. Strategies using a fast RMA crossing a slow RMA produce fewer trades than equivalent EMA crossover systems, with typically higher per-trade quality at the cost of late entries and exits.
As a baseline or filter: Using the RMA as a regime filter — only trading long when price is above the RMA, only trading short when below — provides a stable, non-reactive baseline. Compared to using an EMA for the same purpose, the RMA filter changes direction less frequently and avoids whipsawing in choppy conditions.
Volatility normalisation: Several volatility and momentum indicators — including ATR and RSI — use RMA smoothing internally. When building custom composite indicators in a visual strategy builder, applying RMA smoothing to intermediate calculations produces more stable output than using SMA or EMA in the same role.
Rolling Moving Average Trading Strategies
1. Dual RMA crossover
Use a fast RMA (period 9 or 14) and a slow RMA (period 26 or 50). Enter long when the fast RMA crosses above the slow RMA; exit or go short when it crosses below. The RMA’s smoothing reduces whipsaw signals relative to an equivalent EMA crossover, making this approach more reliable in trending markets than in ranging ones. Pair with an ADX filter to restrict entries to trending conditions.
2. Price vs RMA trend filter
Use a single RMA as a regime gate rather than a signal generator. Only take long entries from other signals (RSI reversals, breakouts, momentum triggers) when the price is above the RMA. Only take short entries when price is below it. The RMA’s stability means this filter switches sides less frequently than an EMA-based equivalent — reducing the number of trades taken in the wrong direction during sideways conditions.
3. RMA slope as momentum confirmation
Measure the rate of change in the RMA itself over a defined period. A rising RMA slope confirms upward momentum. A flat or falling slope signals weakening trend. Use this as an additional entry condition — only entering a position when both the RMA slope is positive and price is above the RMA. This two-condition filter removes entries at the tail end of trends where the trend is still nominally intact but momentum is fading.
What Gets RMA Wrong?
Expecting EMA-like responsiveness at the same period setting. A 14-period RMA is not the same as a 14-period EMA. If you are migrating from an EMA-based system and want similar responsiveness, use a shorter RMA period — roughly half the EMA period. Failing to account for this difference leads to entries and exits that feel frustratingly late.
Applying RMA in ranging markets without a regime filter. The RMA’s strength is tracking trends with minimal noise. In a ranging market, a slow-moving average hugs the midpoint of the range and generates crossover signals late and unreliably. Without a trend filter like ADX or band width, RMA-based systems will produce a string of small losses during consolidation phases.
Confusing RMA with standard EMA in indicator construction. Some platforms label Wilder’s smoothing as EMA when they implement it internally — this is technically incorrect but common. If an indicator description mentions “Wilder’s smoothing” or “modified moving average,” it is using RMA logic regardless of the label. Knowing the distinction matters when replicating or auditing indicator calculations. For a broader comparison of moving average types, Investopedia’s moving average comparison covers the key differences in accessible terms.
Building RMA Strategies in Arrow Algo
Arrow Algo includes the Rolling Moving Average as a native block in the visual builder. Drag the RMA block onto your canvas, connect it to a price input, and set the period in the block’s properties. No formulas required.
To build the dual crossover strategy, add two RMA blocks with different period settings. Connect both to the same price feed. Add a crossover condition block that fires when the fast RMA crosses above the slow RMA. Connect this to a Buy block. Mirror the setup with a crossunder condition connected to a Sell block. Add an ADX block and connect its output to an AND gate to restrict entries to trending conditions.
To build the trend filter version, add a single RMA block. Connect a condition block checking whether the current close is above the RMA output. Route this into an AND gate alongside your primary entry signal. Every entry now requires price to be on the correct side of the RMA before firing.
RMA is also available as the smoothing method within composite indicator constructions. If you are building a custom oscillator and want smoother output than a standard EMA provides, connect the RMA block in place of the EMA in your calculation chain.
Related: EMA Complete Guide | ATR: Volatility Measurement Guide
Key Takeaways
- The Rolling Moving Average applies a smoothing factor of 1/N — half the weight of a same-period EMA — producing a slower, more stable trend line
- A 14-period RMA is roughly equivalent in smoothness to a 27-period EMA; adjust periods accordingly when migrating from EMA-based systems
- RMA excels in trend-following and as a regime filter; it underperforms in ranging markets without a separate trend condition
- RSI and ATR both use RMA smoothing internally — understanding RMA makes those indicators easier to reason about in strategy construction
- Arrow Algo includes a native RMA block; build dual-crossover or trend-filter strategies visually without writing any code
Disclaimer: This content is for educational purposes only and does not constitute financial advice. Trading involves significant risk and you should only trade with capital you can afford to lose. Past performance is not indicative of future results. Always conduct your own research before making any trading decisions.
Ready to build your own automated trading strategies without writing a single line of code? Start for free at Arrow Algo and join thousands of traders who’ve made the switch to systematic trading.