
Parabolic SAR Trading Strategy: How to Build It in Arrow Algo
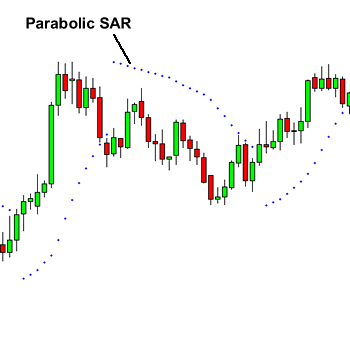
A parabolic SAR trading strategy rides trends with a trailing curve of dots that tightens as the move matures, then flips the moment price breaks it. J. Welles Wilder introduced the indicator in 1978 — SAR stands for “stop and reverse” — and it remains one of the few tools that handles entries, exits, and stop placement in a single mechanism. That makes it a natural fit for fully systematic trading.
How Does a Parabolic SAR Trading Strategy Work?
The indicator plots a dot each bar, below price in an uptrend and above price in a downtrend. While the trend runs, the dots accelerate toward price along a parabolic curve. When price touches the dot, the indicator flips to the other side. A pure parabolic SAR trading strategy treats that flip as the signal: dots move below price, go long; dots move above price, exit or go short.
Two properties matter for algorithmic use. The dots never repaint — once printed, they are final. And the indicator is always in the market, always long or short, which is both its power in trends and its weakness in chop.
What Does the Calculation Actually Do?
You do not need the formula to use the indicator, but the intuition helps. Each bar, the SAR moves toward price by a fraction of the distance to the trend’s extreme point — the highest high of the current uptrend, or lowest low of the downtrend. That fraction is the acceleration factor. It starts at 0.02 and grows by 0.02 each time the trend makes a new extreme, capping at 0.20.
In plain English: young trends get a loose stop, and the stop tightens as the trend keeps proving itself. As Investopedia notes, this built-in acceleration is what locks in profit as a move ages. Raising the maximum acceleration makes the system more sensitive; lowering it gives trends more room. The standard settings (0.02 / 0.20) remain Wilder’s originals.
Reading the Signals in Practice
- Dots below price: uptrend in progress. The latest dot is your live stop level.
- Dots above price: downtrend in progress.
- Flip: price crossed the dots — the prior trend is declared over.
- Dot spacing: widening gaps mean the trend is strong; dots crowding price mean the move is stretched and a flip is near.
Building the Rules: Entries, Exits, and Filters
Raw SAR flips lose money in sideways markets, so the difference between a toy and a tradeable system is the filter.
Strategy A: Filtered Flip
- Entry: SAR flips bullish (dots move below price) while price trades above its 200-period EMA.
- Exit: the next bearish flip — the system trails itself out automatically.
- Why the filter: the EMA keeps you trading flips only in the direction of the larger trend, cutting whipsaw losses dramatically.
Strategy B: SAR as the Exit Engine
- Entry: comes from any other signal — a breakout, a momentum trigger, a crossover.
- Exit: the SAR dot becomes your trailing stop, tightening as the trade works.
- Why it works: many traders find the SAR’s accelerating stop more valuable than its entries. It answers “when do I get out?” with zero discretion.
How to Assemble a Parabolic SAR Trading Strategy in Arrow Algo
Arrow Algo includes a Parabolic SAR block, so the whole system is drag-and-drop:
- Drop in the Parabolic SAR block and connect your candle feed. Its acceleration settings are editable properties — no formulas.
- Add an EMA block (200 period) and a condition block checking price is above it.
- Use a crossover block to detect price crossing the SAR output — that’s your flip signal.
- Combine the flip and the EMA filter as your entry gate, and route the bearish flip to your exit.
- Backtest on live exchange data from Binance, Coinbase, or HyperLiquid, then compare the filtered and unfiltered versions side by side.
For Strategy B, wire the SAR output into your stop logic instead — the same idea explored in our trailing stops guide.
Where Does the Parabolic SAR Struggle?
- Ranging markets. An always-in indicator flips constantly in chop, bleeding losses. Never run it unfiltered.
- Settings overfitting. Tuning the acceleration factor to perfect one backtest usually breaks the next one. Test robustness across nearby values.
- Late entries in fast reversals. The stop accelerates, but a violent reversal can still gap through the dot. Position sizing remains your real risk control.
- Timeframe mismatch. Crypto’s 24/7 volatility on low timeframes produces far more flips than daily charts. Backtest the exact timeframe you will trade.
What Should You Remember?
- The parabolic SAR trading strategy is a complete stop-and-reverse system: trend direction, trailing stop, and exit in one indicator.
- Its accelerating stop tightens as trends age, locking in gains mechanically.
- Unfiltered flips fail in sideways markets — pair the SAR with a trend filter like a long-period EMA.
- Many systematic traders use it purely as an exit engine on top of other entries.
- Arrow Algo’s visual builder lets you build, filter, and backtest both versions without touching a line of code — see the full Parabolic SAR reference guide for deeper background.
Disclaimer: This content is for educational purposes only and does not constitute financial advice. Trading involves significant risk and you should only trade with capital you can afford to lose. Past performance is not indicative of future results. Always conduct your own research before making any trading decisions.
Ready to build your own automated trading strategies without writing a single line of code? Start for free at Arrow Algo and join thousands of traders who’ve made the switch to systematic trading.