The Parabolic SAR (Stop and Reverse) is a powerful technical indicator used by traders to identify potential trend reversals and provide entry and exit points in financial markets. Developed by J. Welles Wilder Jr. in the 1970s, this indicator has become a staple for many traders due to its ability to track price momentum and signal potential trend changes.
The Parabolic SAR appears as a series of dots on a price chart, either above or below the price, depending on the current trend. Its name comes from its parabolic shape when plotted over time and its ability to suggest when to stop and reverse a position.
Algorithmic traders find the Parabolic SAR particularly valuable because of its clear, objective signals and its adaptability to changing market conditions. It can be easily integrated into automated trading systems, providing a systematic approach to entering and exiting trades based on trend reversals.
How Does Parabolic SAR Work?
Mathematical Formula
The Parabolic SAR is calculated using a complex formula that adjusts for market volatility. While we won’t delve into the exact mathematical equations, understanding the conceptual process is crucial for effective implementation in algorithmic trading strategies.
Calculation Process
- Initial SAR: The indicator starts with an “initial SAR” point, typically the most recent significant high or low.
- Acceleration Factor (AF): An acceleration factor, usually starting at 0.02, is applied to adjust the SAR’s sensitivity.
- Extreme Point (EP): The highest high or lowest low (depending on the trend) is tracked as the Extreme Point.
- SAR Calculation: For each period, the SAR is calculated using the previous period’s SAR, the EP, and the AF.
- SAR Adjustment: If the calculated SAR crosses the price or is on the wrong side of the price, it’s adjusted to the EP.
- AF Increment: The AF is increased by 0.02 (default) each time a new EP is reached, up to a maximum of 0.20.
Visual Representation
On a chart, the Parabolic SAR appears as a series of dots. In an uptrend, the dots are below the price; in a downtrend, they’re above. As the trend strengthens, the dots move closer to the price, indicating increasing momentum.
Key Parameters
- Starting AF: Usually 0.02
- AF Step: The increment for AF, typically 0.02
- Maximum AF: Typically capped at 0.20
What It Measures
The Parabolic SAR essentially measures the momentum of a trend and its potential for reversal. It adapts to volatility, accelerating as the trend strengthens and decelerating as it weakens.
How to Read Parabolic SAR Signals?
Reading the Indicator
- Dots below price: Bullish trend
- Dots above price: Bearish trend
- Dot position flip: Potential trend reversal
Common Trading Signals
- Buy Signal: When the dots flip from above the price to below
- Sell Signal: When the dots flip from below the price to above
Signal Strength
- Strong Trend: Dots are far from the price
- Weakening Trend: Dots move closer to the price
- Potential Reversal: Dots are very close to the price
Confirmations
- Look for additional confirmation from other indicators or price action
- Multiple timeframe analysis can strengthen signals
Divergences
While not typically used for divergence analysis, traders can observe the relationship between SAR dot spacing and price movement for additional insights.
What Are the Best Parabolic SAR Trading Strategies?
1. Basic Trend Following Strategy
- Entry: Enter long when SAR dots flip below price, short when they flip above
- Exit: Exit when dots flip to the opposite side
- Stop Loss: Place stop loss at the most recent SAR dot
- Timeframe: Works well on daily charts for longer-term trends
2. SAR with Moving Average Confirmation
- Indicators: Parabolic SAR + 50-day Simple Moving Average (SMA)
- Long Entry: SAR dots flip below price AND price is above 50 SMA
- Short Entry: SAR dots flip above price AND price is below 50 SMA
- Exit: When SAR dots flip or price crosses the SMA in the opposite direction
- Timeframe: Effective on 4-hour or daily charts
3. Volatility Breakout Strategy
- Indicators: Parabolic SAR + Average True Range (ATR)
- Entry: When SAR dots flip AND price moves beyond the previous day’s high/low by 1 ATR
- Exit: When SAR dots flip back or price moves 2 ATR in the opposite direction
- Stop Loss: 1.5 ATR from entry
- Timeframe: Works well on 1-hour charts for intraday trading
Best Market Conditions
Parabolic SAR excels in trending markets with clear directional movement. It’s particularly effective in forex and commodities markets that exhibit strong trends.
When Not to Use
Avoid using Parabolic SAR in choppy, sideways markets as it can generate frequent false signals. It’s also less reliable during periods of low volatility or in markets with sudden, large price spikes.
Implementation in Algo Trading
Integration into Algorithmic Strategies
To incorporate Parabolic SAR into your algorithmic trading strategy using Arrow Algo’s visual block builder:
- Add a Parabolic SAR indicator block to your strategy
- Configure the SAR parameters (Starting AF, AF Step, Maximum AF)
- Create decision blocks based on SAR signals
- Connect SAR signals to entry and exit logic blocks
Automated Decision-Making
You can build a strategy that:
– Enters trades when the SAR dots flip sides
– Exits trades when the SAR signals a potential reversal
– Adjusts position size based on the distance between SAR dots and price
Backtesting Considerations
When backtesting Parabolic SAR strategies:
– Test across different market conditions (trending vs. ranging)
– Analyze performance in various timeframes
– Consider the impact of transaction costs on frequent trades
Common Pitfalls
- Overtrading in choppy markets
- Ignoring other market factors (support/resistance, fundamentals)
- Relying solely on SAR without confirmation
Optimization Tips
- Experiment with different AF settings for various assets and timeframes
- Combine SAR with trend-following indicators for confirmation
- Use SAR as an exit strategy in conjunction with other entry signals
Building with Arrow Algo‘s Block Builder
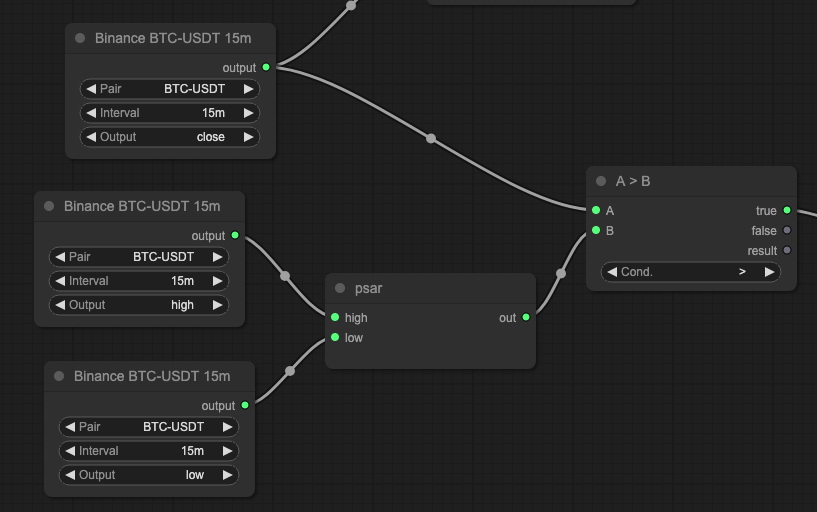
Arrow Algo‘s NO-CODE block builder makes it easy to implement Parabolic SAR strategies without writing a single line of code. Here’s how:
- Add Indicator: Drag and drop the Parabolic SAR indicator block onto your strategy canvas.
- Configure Parameters: Double-click the SAR block to open its settings. Adjust the Starting AF, AF Step, and Maximum AF visually.
- Create Logic: Add decision blocks that check for SAR dot flips. For example:
- “If SAR dot is below price AND was above price in previous period, then…”
- “If SAR dot is above price AND was below price in previous period, then…”
- Connect to Actions: Link your SAR logic blocks to action blocks like “Enter Long Position” or “Exit Short Position”.
- Add Filters: Drag in additional indicator blocks (e.g., Moving Average) and create logic to filter SAR signals.
- Set Position Sizing: Use mathematical blocks to calculate position size based on SAR dot distance from price.
- Backtest and Optimize: Use Arrow Algo’s built-in backtesting tools to evaluate your strategy’s performance across different market conditions and timeframes.
Remember, with Arrow Algo, you’re building your strategy visually – no coding required. This allows you to focus on strategy logic and market analysis rather than programming syntax.
Conclusion
The Parabolic SAR is a versatile indicator that can significantly enhance algorithmic trading strategies, particularly for trend identification and reversal detection. Its clear signals and adaptability to market volatility make it an excellent tool for systematic trading approaches.
Key takeaways:
– Use SAR in trending markets for best results
– Combine with other indicators for signal confirmation
– Adjust parameters to suit different assets and timeframes
– Be cautious in choppy or ranging markets
By implementing Parabolic SAR strategies using Arrow Algo’s visual block builder, traders can quickly test and refine their ideas without the need for complex coding. This allows for rapid strategy development and optimization, giving algo traders a significant edge in today’s fast-paced markets.
Ready to build your own strategies using Parabolic SAR? Visit https://www.arrowalgo.com to start creating custom indicator-based strategies with Arrow Algo’s NO-CODE block builder platform.
Disclaimer: Algorithmic trading involves substantial risk. Past performance is not indicative of future results.
This content is for educational purposes only and should not be considered financial advice.
Always do your own research and consider consulting with a financial advisor before making trading decisions.