
PPO Trading Strategy: How to Build It in Arrow Algo
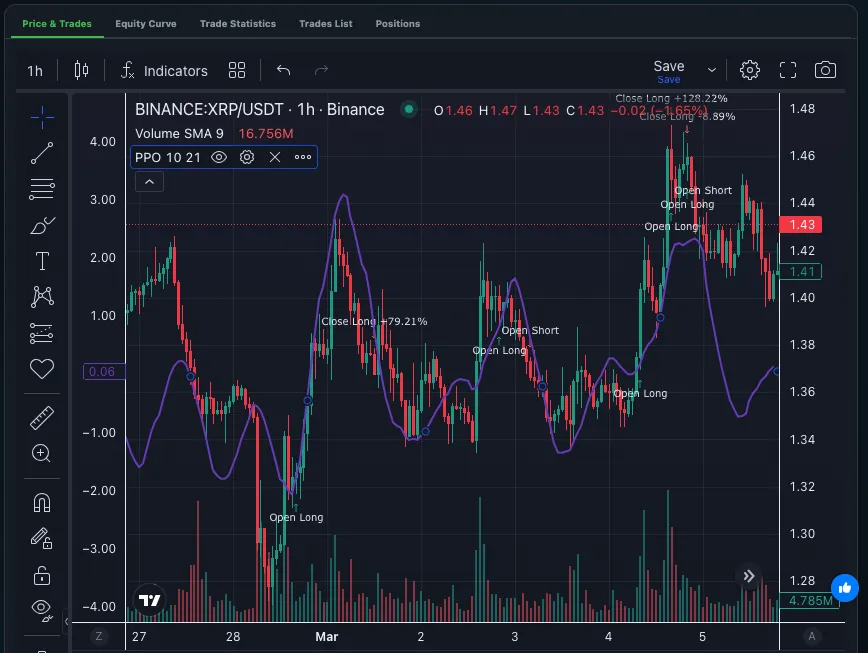
Every momentum reading MACD gives you, the Percentage Price Oscillator gives you as a percentage. That single change is what makes a PPO trading strategy portable across assets.
MACD outputs a raw price difference. On Bitcoin at $83,000, a MACD value of 400 is small. On Cardano at $0.236, the same number is impossible. PPO sidesteps that entirely by dividing the difference by the slower average.
This guide covers what the reading actually measures, three rule sets worth testing, and a no-code build in Arrow Algo’s visual block builder. Every setting below is a starting point for your own backtests.
What a PPO Trading Strategy Actually Trades
A PPO trading strategy trades the gap between two exponential moving averages, expressed as a percentage of the slower one.
The standard settings are 12 and 26 periods, with a 9-period signal line. Those come straight from MACD convention. The maths is simple: subtract the 26-period EMA from the 12-period EMA, then divide by the 26-period EMA and multiply by 100.
A PPO of 2 means the fast average sits 2% above the slow average. A PPO of -1.5 means it sits 1.5% below. The unit is the same whether you trade BTC, SOL or a $0.20 altcoin.
That normalisation is the whole point. It lets you compare momentum across a basket of assets and use one threshold everywhere.
Reading the Three PPO Outputs
The indicator produces three values, and each answers a different question.
The PPO line answers how far momentum has stretched. Large positive readings mean the fast average has pulled well above the slow one. Large negative readings mean the opposite.
The signal line is a 9-period EMA of the PPO line. It answers whether momentum is still accelerating or has started to fade. Crossings between the two mark the turn.
The histogram is the PPO line minus the signal line. It answers how fast the change is happening. A shrinking histogram warns you that a trend is losing force before the lines actually cross.
Zero matters too. PPO above zero means the fast EMA leads the slow one, which is the classic definition of an uptrend. Below zero flips that.
Three PPO Trading Strategy Rule Sets
Signal-line crossover with a trend filter
This is the workhorse. Enter long when the PPO line crosses above its signal line. Exit when it crosses back below.
Run it raw and it will churn in sideways markets. Add a filter: only take long crossovers while PPO is above zero. That single condition removes most counter-trend signals.
The trade-off is late entries. You will miss the first leg of every reversal. In exchange you skip the majority of false starts.
Threshold reversion inside ranges
PPO is bounded in practice, not in theory. Each asset has a range it rarely exceeds. On daily Bitcoin candles, readings beyond plus or minus 4% are uncommon.
Measure that range on your own data first. Then fade the extremes: short when PPO pushes above your upper threshold and turns down, long when it drops below the lower one and turns up.
This only works in ranging conditions. Pair it with a low ADX reading or a flat 200-period moving average, or it will fight strong trends and lose.
Divergence against price
Price makes a higher high. PPO makes a lower high. That mismatch says the new high came with less momentum behind it.
Divergence is a warning, not an entry. Use it to tighten stops on an open position or to demand extra confirmation before adding. Traders who enter on divergence alone tend to be early and repeatedly stopped.
Why PPO Travels Better Than MACD
Here is the practical advantage. Build a strategy with a MACD threshold of 300 and it only makes sense on one asset at one price level. Bitcoin at $30,000 and Bitcoin at $83,000 need different numbers.
A PPO threshold of 2% means the same thing at both prices. It also means the same thing on Solana and on XRP.
That matters for two reasons. First, you can test one rule set across a whole watchlist without retuning. Second, your backtest stays valid as the asset appreciates over the test window. A MACD threshold silently drifts out of calibration during a bull market. PPO does not.
If you want the full reference on the calculation and its variations, our complete guide to the Percentage Price Oscillator covers the mechanics in more depth.
Where PPO Strategies Break Down
Sideways markets. Both EMAs converge near zero and the lines cross constantly. Each crossing is a trade, and most are noise. A trend filter is not optional here.
Low-volatility assets. PPO percentages compress when an asset barely moves. Thresholds tuned on a volatile pair will almost never trigger on a quiet one.
Over-tuned periods. It is tempting to test 47 combinations of fast, slow and signal periods and pick the best. That result rarely survives out of sample. Test a small grid and prefer settings that work across neighbouring values.
Ignoring costs. Crossover systems trade often. At 40 round trips a year, a 0.1% fee plus slippage eats roughly 8% of capital before any profit. Model it or your backtest is fiction.
Investopedia’s PPO reference and the StockCharts ChartSchool entry both cover the standard interpretation if you want a second source.
Building a PPO Trading Strategy in Arrow Algo
No code is needed. Everything below is drag-and-drop on the visual canvas.
Start by dropping a PPO block onto the canvas. Set the fast period to 12, the slow to 26 and the signal to 9. Connect your chosen candle source to its input.
Add a crossover block. Feed the PPO line into one input and the signal line into the other. This fires the moment the two lines swap positions.
Add a comparison block for the trend filter. Compare the PPO line against a fixed value of zero. This outputs true only while momentum is positive.
Join the two with a condition block set to AND. Both must be true before anything happens. That combined output becomes your long entry.
For the exit, mirror the logic. Use a second crossover block, this time checking for the PPO line falling back below its signal.
Add an ATR-based stop underneath. Volatility-scaled stops hold up better than fixed percentages when market conditions shift.
Then backtest it. Arrow Algo pulls live historical data directly from Binance, Coinbase and HyperLiquid, so you test on the exchange’s own candles. Run the same rule set across three or four assets. Because PPO is normalised, you do not need to change a single threshold between them.
What to Take Into Your First Backtest
- PPO measures the EMA gap as a percentage, which makes thresholds portable across assets and price levels.
- The signal-line crossover is the core entry. A zero-line trend filter removes most of its false signals.
- Threshold reversion belongs in ranges only. Gate it with a trend or volatility filter.
- Divergence is a warning signal for managing open trades, not a standalone entry.
- Crossover systems trade frequently, so model fees and slippage before trusting any equity curve.
- Test one rule set across several assets rather than tuning many parameters on one.
Disclaimer: This content is for educational purposes only and does not constitute financial advice. Trading involves significant risk and you should only trade with capital you can afford to lose. Past performance is not indicative of future results. Always conduct your own research before making any trading decisions.
Ready to build your own automated trading strategies without writing a single line of code? Start for free at Arrow Algo and join thousands of traders who've made the switch to systematic trading.