
RSI Overbought Oversold Strategy: How to Build It in Arrow Algo
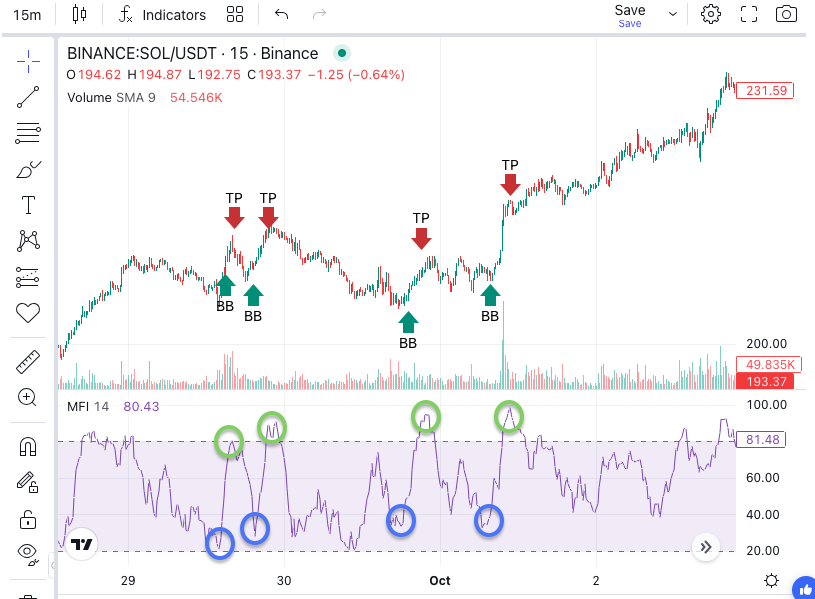
The RSI overbought oversold strategy is one of the most widely traded systematic approaches in crypto and equity markets, built on a core principle: when price moves too far too fast, a reversal is likely. This guide explains how the strategy works, what causes it to fail, and how to build it with no-code visual blocks in Arrow Algo.
What Is the RSI Overbought Oversold Strategy?
The Relative Strength Index (RSI) is a momentum oscillator measuring the speed and size of recent price changes on a scale from 0 to 100. The overbought oversold strategy uses two threshold levels to generate signals:
- Oversold (below 30): Price has declined sharply and selling momentum may be exhausted. A recovery could follow.
- Overbought (above 70): Price has risen sharply and buying momentum may be fading. A pullback could follow.
The underlying logic is mean reversion: after an extreme move away from average, price tends to return. The strategy turns this observation into systematic entry and exit rules. It performs best in ranging markets where price oscillates without a sustained directional trend.
How Do Overbought and Oversold Signals Work?
RSI rising above 70 means recent gains have been disproportionately large compared to recent losses. The market has moved far and fast. This does not guarantee a reversal — in strong uptrends, RSI can hold above 70 for many candles — but it signals the move is extended and risk is elevated for new entries in the same direction.
RSI falling below 30 indicates the opposite: recent losses dominate. In a ranging environment, this is frequently followed by a bounce toward the mean.
Two distinct ways to use these signals:
- Mean reversion entries: Buy when RSI drops below 30 and exit when RSI recovers above 50. Short when RSI rises above 70 and exit when it falls back below 50. This bets on a return to the middle of the range.
- Exit filter: Use overbought or oversold readings to close existing positions rather than open new ones. When RSI exceeds 70 on an open long, it signals the trade may be near its peak.
For a different RSI approach, see the RSI divergence strategy, which uses price and indicator divergence rather than level thresholds.
What RSI Thresholds Actually Work?
The default 70/30 levels are a starting point, not a fixed rule. In crypto markets — where volatility significantly exceeds traditional assets — 70/30 generates a high signal frequency, including many false positives.
Raising the overbought threshold to 80 and lowering the oversold threshold to 20 reduces signal count but typically improves signal quality. Fewer trades, each with higher probability of following through.
On shorter timeframes (1-minute, 5-minute), RSI oscillates rapidly and any fixed threshold produces noise. On 4-hour or daily charts, the same thresholds reflect more meaningful momentum extremes.
RSI thresholds are inputs to optimise, not conventions to accept. Backtest multiple combinations on the specific asset and timeframe you plan to trade before committing to any parameter.
How to Filter Out False Signals
The most common failure mode is using this strategy in a trending market. In a sustained uptrend, RSI can remain above 70 for extended periods. Shorting every overbought reading during a bull run produces consistent losses.
Three filters that address this:
ADX regime filter: Only take RSI signals when ADX is below 25, confirming the market is ranging rather than trending. When ADX rises above 25, skip all mean reversion entries. This single addition eliminates the most common failure condition of the strategy.
Bollinger Band confirmation: Require price to be at or beyond the lower Bollinger Band when RSI crosses below 30. When both agree simultaneously, the signal carries more weight.
Volume confirmation: Low-volume RSI extremes often resolve weakly. Require volume to be above its moving average when the signal fires. High-volume extremes more reliably mark exhaustion.
What Are the Common Mistakes to Avoid?
- Trading every RSI level without confirmation: RSI alone generates too many signals across different market conditions. At least one additional filter is required to distinguish signal from noise.
- Using identical thresholds across all assets and timeframes: The right oversold level for BTC on a 4-hour chart is not right for SOL on a 15-minute chart. Each combination deserves independent backtesting.
- Shorting overbought readings in a bull trend: Fighting the dominant direction is the most expensive mistake in mean reversion trading. Use the higher timeframe trend as a directional gate.
- No stop loss: RSI extremes signal probability, not certainty. Overbought markets can become more overbought. Define maximum acceptable loss before every entry.
How to Build This Strategy in Arrow Algo
Arrow Algo’s no-code visual block builder lets you assemble this strategy entirely through drag-and-drop — no programming required.
Add your indicators: An RSI block (set the period — default 14 or test alternatives) and an ADX block for the regime filter.
Entry logic (long):
- Condition block: RSI output below 30 (or 20 for volatile assets)
- Condition block: ADX output below 25
- Connect both to an AND block — the entry fires only when both conditions are true simultaneously
Exit logic:
- Condition block: RSI crosses above 50 (recovery exit) or 70 (full reversion target)
- Stop loss on the entry block to cap downside if the anticipated reversal does not materialise
Run a backtest to review signal count, win rate, and average duration. Adjust thresholds iteratively until results match your risk profile. Arrow Algo’s backtest results show the performance impact of each change in real time.
Key Takeaways
- The RSI overbought oversold strategy uses RSI levels above 70 and below 30 to identify potential reversals
- It performs best in ranging markets — in trending conditions RSI can hold at extremes for extended periods
- An ADX filter (ADX < 25) eliminates the most common failure mode of the strategy
- Default 70/30 thresholds are a starting point — 80/20 often performs better in volatile crypto markets
- Always pair with a defined stop loss — RSI extremes indicate probability, not certainty
- Build and backtest the full strategy in Arrow Algo’s no-code visual block builder
Disclaimer: This content is for educational purposes only and does not constitute financial advice. Trading involves significant risk and you should only trade with capital you can afford to lose. Past performance is not indicative of future results. Always conduct your own research before making any trading decisions.
Ready to build your own automated trading strategies without writing a single line of code? Start for free at Arrow Algo and join thousands of traders who’ve made the switch to systematic trading.