
Standard Deviation Breakout Strategy: How to Build It in Arrow Algo
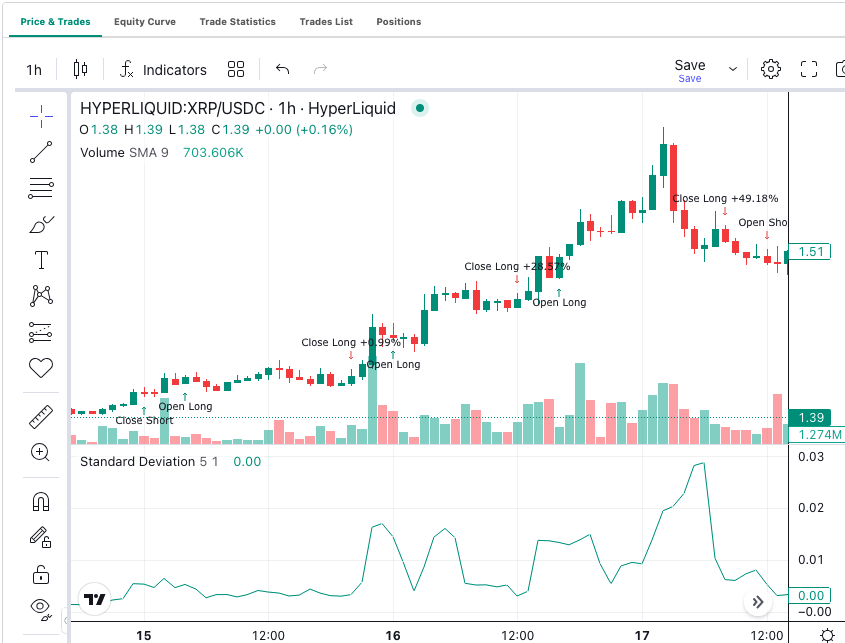
A standard deviation breakout strategy does not try to predict which way price will go. It waits for the market to go quiet, then trades the first move out of that quiet. Standard deviation measures how far price has been straying from its average over a set number of bars. When that number shrinks, the market is coiling. When it jumps, the coil has released. Our standard deviation guide explains the indicator. This post is about turning it into breakout rules you can backtest.
What Does Standard Deviation Tell a Breakout Trader?
Standard deviation is the raw ingredient behind Bollinger Bands. The bands are just a moving average plus and minus two standard deviations. Using the indicator directly, without the bands, gives you two things the bands hide.
First, you can read the volatility number on its own. A 20-bar standard deviation of $400 on Bitcoin means a typical close has sat about $400 from the 20-bar average. If that falls to $150, the market has gone quiet. Wikipedia’s entry covers the maths, but the trading use is simple: small number, calm market; large number, active market.
Second, you can compare that number with its own history. Standard deviation today against standard deviation over the last 100 bars tells you whether the current calm is unusual. Unusual calm is what breakout traders want. Volatility tends to cluster, so a quiet stretch is usually followed by a loud one. Our volatility clustering post covers why.
How Does a Standard Deviation Breakout Set Up?
The setup has two stages. Compression, then expansion.
Compression is when the 20-bar standard deviation falls below some fraction of its longer-term average. A common rule is below 60% of the 100-bar average. The market has been drifting in a tight band for long enough that the usual noise has dropped away.
Expansion is the first bar that breaks out of that band with volatility rising. Two conditions confirm it. Price closes above the recent high, or below the recent low. And the standard deviation reading is higher than it was a few bars ago.
The entry fires on expansion, not on compression. Compression only arms the trade. Plenty of traders get this backwards and buy the calm, which means sitting in a dead market waiting for something to happen.
Three Standard Deviation Breakout Rules to Test
Each version below adds one idea. Backtest them in order and keep the one that holds up.
The Band Breakout Without Bands
Go long when the close is above the 20-bar simple moving average plus two times the 20-bar standard deviation. Go short, or exit, when it closes below the average minus two standard deviations. This is a Bollinger breakout with the bands removed, and it is the baseline. Expect it to fire often in trending markets and get chopped in ranges.
The Compression-Armed Breakout
Only take the band breakout if the 20-bar standard deviation was below 60% of its 100-bar average at some point in the last 10 bars. This filters out breakouts that happen mid-trend, when volatility is already high. Trade count drops sharply. Average winner usually rises, because you are catching the start of the move rather than the middle.
The Expansion-Confirmed Breakout
Take the compression-armed breakout, but also require the current standard deviation to be higher than it was five bars ago. This confirms that volatility is actually rising on the breakout bar. It removes the thin breakouts that creep over the band and fall back. It also costs you a bar or two of entry.
Which Settings Should You Start With?
| Setting | Starting value | What it controls |
|---|---|---|
| StdDev period | 20 | How quickly the volatility reading reacts |
| Long average period | 100 | What counts as “normal” volatility |
| Compression ratio | 0.6 | How quiet the market must get to arm a trade |
| Band multiplier | 2.0 | How far price must stray to count as a breakout |
| Expansion lookback | 5 | How many bars back to compare volatility |
Test a range around each value. A compression ratio that works at 0.6 but fails at 0.5 and 0.7 is noise. A multiplier of 2.0 that holds at 1.8 and 2.2 is a real setting.
One warning on the multiplier. Standard deviation is in price units. A $400 reading on Bitcoin and a $0.004 reading on a small altcoin are not comparable. If the strategy runs on several pairs, divide the standard deviation by price so the threshold is a percentage. A Math block handles that in one step.
Where Does a Standard Deviation Breakout Fail?
The failure mode is the fakeout. Price pokes through the band, volatility ticks up, the entry fires, and price reverses inside two bars. No filter removes all of these. Three mistakes make them more common:
- Entering on compression. Buying because the market is quiet is a bet on direction with no evidence. Wait for the break.
- Using a short long-average period. If “normal” volatility is measured over 30 bars, every small lull looks like compression. Use at least 100 bars.
- Ignoring the session. On crypto, weekend volatility is lower than weekday volatility. A compression filter will arm on Sunday and fire on Monday morning almost every week. Test whether those Monday breakouts actually pay, or add a time filter so the strategy sits out the weekend.
A stop is not optional here. Place it on the opposite side of the compression range. If the breakout was real, price will not revisit the middle of the coil.
Building a Standard Deviation Breakout Strategy in Arrow Algo
The compression-armed version takes about ten blocks. No code at any point.
- Place a Data Watcher for the pair and timeframe, such as BTC/USDT on the 4-hour chart.
- Add a StdDev block with period 20 and an SMA block with period 20, both fed from the close.
- Add a second SMA block with period 100, fed from the StdDev output. This is the long-term average of volatility.
- Use a Math block to multiply the 100-bar average by 0.6. A Condition block checks whether the current StdDev is below that. This is the compression flag.
- Use two more Math blocks to build the upper band: StdDev times 2, added to the 20-bar SMA. A Condition block checks whether the close is above it.
- Combine the compression flag and the band break with a Condition block set to AND. Connect it to a Buy action.
- For the exit, build the lower band the same way and connect a close-below condition to a Sell action. Set the stop-loss on the order block.
For the expansion confirmation, add a Lag block on the StdDev output set to five bars. A Condition block checks that the current StdDev is greater than the lagged value, and that becomes a third input to the AND gate.
Run the backtest on at least two years. Then compare the trade counts between the three versions. If the compression filter removed 70% of trades but the profit barely changed, the filter is doing its job.
What Matters Most Here?
- A standard deviation breakout strategy trades the expansion after a quiet period, not the quiet period itself.
- Compare current volatility with its long-run average to find genuine compression. A 100-bar average is a sensible floor.
- Confirm the breakout with rising volatility on the entry bar, and accept that this costs a little entry.
- Normalise standard deviation by price before running the strategy across several pairs.
- In Arrow Algo the whole setup is StdDev, SMA, Math, Condition and Lag blocks. Add one filter at a time and backtest each.
Disclaimer: This content is for educational purposes only and does not constitute financial advice. Trading involves significant risk and you should only trade with capital you can afford to lose. Past performance is not indicative of future results. Always conduct your own research before making any trading decisions.
Ready to build your own automated trading strategies without writing a single line of code? Start for free at Arrow Algo and join thousands of traders who've made the switch to systematic trading.