
Ultimate Oscillator Divergence Strategy: How to Build It in Arrow Algo
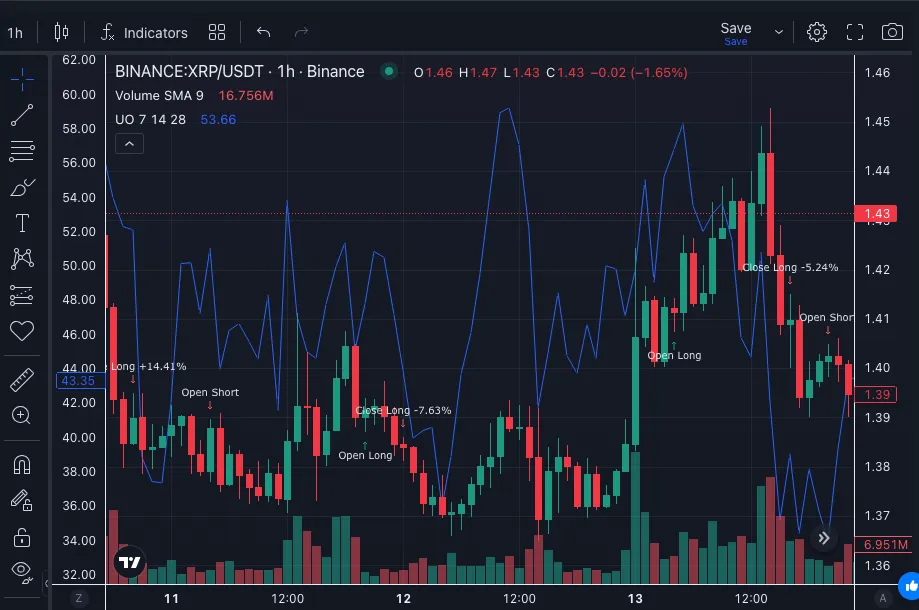
An Ultimate Oscillator divergence strategy needs more than two lines pointing in opposite directions. It needs identifiable swings, a confirmation trigger and rules that work without seeing future candles.
That final requirement catches many otherwise sensible ideas. A divergence can look obvious on yesterday’s chart. An algorithm must decide when enough evidence existed to act.
This guide turns the pattern into a testable specification. The examples illustrate rule design; they are not backtest results or recommended settings.
What Does an Ultimate Oscillator Divergence Strategy Look For?
The strategy compares price swings with momentum readings. A bullish setup pairs a lower price low with a higher oscillator low. A bearish setup pairs a higher price high with a lower oscillator high.
Larry Williams developed the Ultimate Oscillator to combine three lookback periods. Its familiar settings are 7, 14 and 28 candles. Those periods all use the chosen chart interval. They do not automatically combine hourly, daily and weekly charts.
The oscillator ranges from zero to 100. The conventional extreme zones are below 30 and above 70. An extreme reading alone does not establish a reversal. Fidelity’s indicator guide describes the indicator and its classic signals.
How Do Buying Pressure and Three Lookbacks Combine?
The calculation begins with each candle’s close, high, low and the previous close.
Buying pressure measures the close’s distance above the lower of today’s low and the previous close. True range measures the distance between the higher high reference and the lower low reference. Both references include the previous close.
For each lookback, total the buying pressure and divide by total true range. Weight the seven-candle ratio four times, the fourteen-candle ratio twice and the twenty-eight-candle ratio once. Divide their combined total by seven, then multiply by 100.
The shortest window therefore has the greatest influence. Longer windows contribute context without replacing it. Interactive Brokers’ calculation reference sets out the same weighting.
Use the native indicator block for this calculation. The more demanding work is defining which swings the strategy compares.
When Does Divergence Become a Confirmed Signal?
The classic bullish sequence has three parts:
- Price makes a lower low, but the oscillator makes a higher low.
- The oscillator reaches below 30 during the divergence.
- The oscillator subsequently breaks above its intervening high.
For bearish confirmation, reverse the pattern. Price makes a higher high, the oscillator makes a lower high, and the pattern reaches above 70. Confirmation comes when the oscillator breaks below its intervening low.
TradingView’s Ultimate Oscillator documentation describes these three-stage signals. Crossing back above 30 is not equivalent to breaking the divergence’s intervening high.
A Hypothetical Bullish Example
Imagine a first price low at $100 with an oscillator reading of 24. Price rebounds, and the oscillator reaches 46. A later price low reaches $98, but the oscillator holds at 29.
The opposing swing directions establish the candidate pattern. The confirmation threshold is 46. An oscillator close at 38 would leave that condition unfulfilled.
If your swing definition requires two later candles, wait for those candles too. The pattern becomes available only then.
Which Ultimate Oscillator Divergence Strategy Variants Can You Test?
Start with one version and write its rules before reviewing results.
Reversal With a Fixed Invalidation Level
For an educational long-only test, require the bullish sequence and no existing position. Enter only after confirmation becomes available.
Place the protective stop below the second price low, using a predefined buffer. Choose the exit rule separately. One test might use a fixed reward-to-risk target; another might use a time limit.
Record each version as a separate experiment. Do not switch exit rules retrospectively to rescue individual trades.
Pullback Within a Broader Uptrend
Add a trend filter, such as price above a 200-period exponential moving average. Keep the divergence rules unchanged.
This asks a different question: does the pattern help time pullbacks inside an existing uptrend? The filter might reduce adverse trades. It can also remove profitable opportunities and shrink the sample.
Bearish Divergence as a Long Exit
A spot strategy can use confirmed bearish divergence to close a long position. It need not open a short.
Compare that exit with the baseline exit on the same entries. This isolates the exit’s contribution more clearly.
Why Can a Divergence Backtest Look Better Than Reality?
Future-dependent pivots are a common trap. Suppose a swing low needs two candles on each side. You cannot recognise it at the low itself. Record the signal after the second confirming candle closes.
Unmatched observations create false patterns. Compare oscillator readings associated with your defined price swings. Do not select convenient indicator lows from unrelated timestamps.
Rolling minima are not automatically swing detection. Comparing two window minima can define a useful alternative. It still needs its own label and validation.
Timing, Costs and Repeated Signals
Define whether a confirmation uses the candle close. Specify when the next order can fill under your backtest’s execution model. Our candle close confirmation guide explains why those timestamps matter.
Prevent an unchanged pattern from opening repeated positions. Reset the setup after entry, invalidation or a predefined expiry.
Include fees and realistic slippage. Stops can fill beyond their trigger during fast moves. Changing oscillator periods cannot remove that execution risk.
How Can You Assemble the Rules in Arrow Algo?
Arrow Algo’s indicator documentation includes the Ultimate Oscillator block. Add it to the same market data stream used for your price rules. Start with the 7, 14 and 28 lookbacks.
The indicator supplies momentum readings. It does not, by itself, identify and remember every divergence pattern.
Specify the Pattern Before Connecting Blocks
Write down the information your visual strategy must retain:
- Two confirmed price swings and their associated oscillator readings.
- The oscillator extreme reached during the pattern.
- The intervening confirmation level, setup age and invalidation level.
Use the visual builder’s available comparisons, stored values and position checks to express those requirements. An AI assistant connected to Arrow Algo can help assemble the graph.
Ask it to verify the available blocks first. Require it to explain when each stored value changes. A proposed graph must demonstrate swing confirmation and setup resets before you treat it as a divergence strategy.
If the available configuration cannot represent your pivot definition, simplify the specification explicitly. Do not present a threshold-only approximation as the full pattern.
Inspect Trades Before Comparing Returns
Backtest on your chosen exchange and pair. Examine several winning and losing entries candle by candle.
Check the pivot timestamps, oscillator readings and confirmation level. Verify that the order follows the moment all conditions become knowable.
Then test a separate period without changing the rules. Compare drawdown, trade count and costs alongside returns. A visually convincing signal may still have no durable trading edge.
What Should You Remember Before Testing?
- Divergence identifies a candidate setup; confirmation supplies a separate trigger.
- Three lookbacks describe different lengths on the selected chart interval.
- Confirmed swings introduce delay. Include that delay in the backtest.
- State exactly how a setup expires, resets and avoids duplicate entries.
- Validate the visual block logic before interpreting performance.
Disclaimer: This content is for educational purposes only and does not constitute financial advice. Trading involves significant risk and you should only trade with capital you can afford to lose. Past performance is not indicative of future results. Always conduct your own research before making any trading decisions.
Ready to build your own automated trading strategies without writing a single line of code? Start for free at Arrow Algo and join thousands of traders who've made the switch to systematic trading.