
VPT Divergence Strategy: What Three Years of Data Show
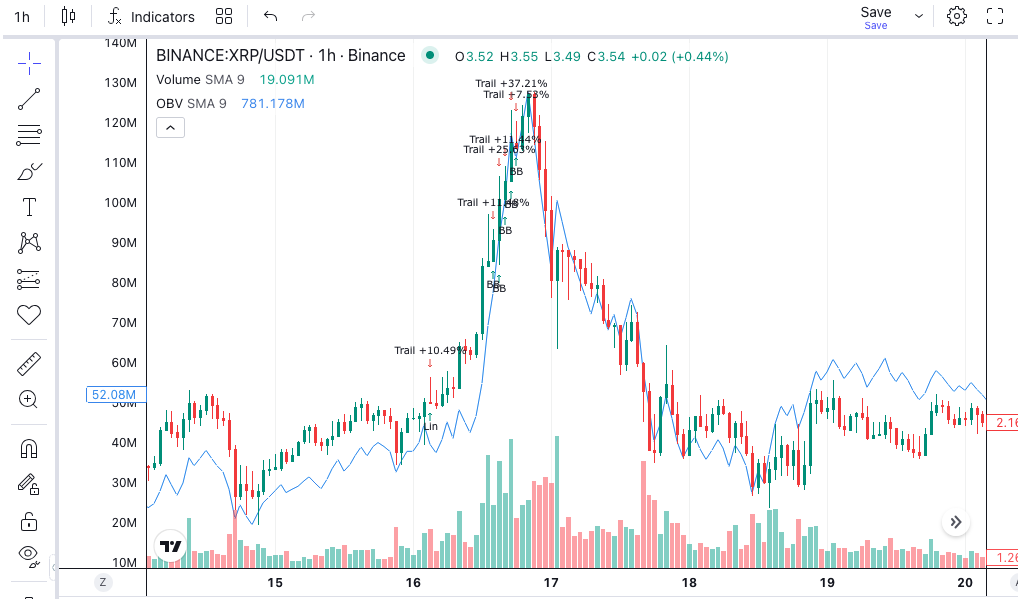
A VPT divergence strategy asks a simple question every time price makes a new low: did volume agree? When price falls to fresh lows but the Volume Price Trend does not, sellers may be running out of conviction. We tested that idea on three years of crypto candles. The divergence condition did not make the strategy a winner. It did cut out most of the worst trades.
The rules below are hypotheses to test, not a recommendation.
What Does VPT Divergence Look Like?
The Volume Price Trend (VPT) is a running total of volume, weighted by each candle’s percentage price change. A 3% rise on heavy volume adds a lot. A 0.1% dip on the same volume subtracts very little. Our Volume Price Trend guide covers the calculation in full.
A divergence happens when price and an indicator point in different directions. A bullish VPT divergence has two parts:
- Price closes at a new short-term low.
- VPT stays above its own low for the same period.
In plain English, price fell further, but the volume-weighted selling behind it was lighter. That is the setup traders hope marks a bounce.
Turning Divergence Into a Rule a Backtest Can Run
Divergence is easy to spot by eye and hard to define. Drawing lines between swing lows invites hindsight. A backtest needs a rule that reads only completed candles.
We used a fixed lookback instead of hand-picked swings. The lookback is the number of past candles a rule compares against.
Entry Conditions
Use four-hour candles. Generate a long entry signal when both hold on a completed candle:
- The close is the lowest close of the last 20 candles.
- VPT is above its lowest value of the last 20 candles.
Exit Conditions
Exit on the first of three events:
- The close moves back above the 20-period exponential moving average (EMA).
- The close falls more than two times the 14-period Average True Range (ATR) below entry. ATR measures typical candle movement.
- Thirty candles pass without either exit, which is five days.
The Control You Must Run
Remove the VPT condition and keep everything else. The control buys every new 20-candle low. This answers the only question that matters: does VPT filter out bad entries, or just reduce the trade count?
What Happened on Three Years of Crypto Data?
We tested both versions on Binance four-hour candles from November 2023 to November 2026. We charged 0.1% per side and filled at the signal candle’s close. The first 200 candles were excluded as warm-up.
| Market, 4-hour | Control: entries per year | Control: return | Control: max drawdown | VPT rule: entries per year | VPT rule: return | VPT rule: max drawdown | Buy-and-hold |
|---|---|---|---|---|---|---|---|
| BTC | 72 | -23.8% | 46.7% | 21 | -3.8% | 24.7% | +79.9% |
| ETH | 70 | -60.8% | 72.2% | 24 | +33.5% | 21.9% | -4.9% |
| SOL | 78 | -1.2% | 61.8% | 29 | -15.5% | 44.5% | +39.3% |
Hypothetical rule tests on past data, with no slippage. They are not trading results, and past behaviour may not repeat.
Buying every new low was a poor idea on all three markets. On ETH, the control lost 60.8%. Max drawdown is the largest peak-to-trough fall in account value.
The VPT condition removed about two-thirds of entries. It improved the result on BTC and ETH and cut drawdown on every market. On SOL, it made the return worse. Some of the drawdown improvement comes simply from spending less time in the market.
Adding a Trend Filter
Dip-buying usually works better inside an uptrend. We added one more condition to both versions: the close must sit above the 200-period EMA.
| Market, 4-hour | Control: entries per year | Control: return | Control: max drawdown | VPT rule: entries per year | VPT rule: return | VPT rule: max drawdown |
|---|---|---|---|---|---|---|
| BTC | 27 | -19.0% | 31.1% | 8 | +3.3% | 11.7% |
| ETH | 24 | -14.3% | 30.6% | 10 | +10.1% | 15.5% |
| SOL | 26 | +55.9% | 28.8% | 7 | +18.4% | 14.7% |
Same assumptions as above.
The filter helped the control on every market. The VPT version again beat its control on BTC and ETH. On SOL, the plain filtered control did best of all.
How Should You Read These Results?
The honest summary is mixed. VPT divergence looks like a useful filter, not a complete strategy. It removed many losing entries. It did not beat buy-and-hold on BTC or SOL.
The samples are also small. The filtered VPT rule made only 21 to 30 trades per market in three years. A handful of trades can swing a total that small.
Win rates were high, between 62% and 81%. Returns were still modest. That pattern means small frequent wins and a few large losses. Our post on return skew explains why that shape needs care.
Where Do VPT Divergence Backtests Go Wrong?
Drawing divergences by hand. Picking swing lows after the fact makes every divergence look clean. Use a fixed lookback that only reads completed candles.
Skipping the control. A profitable divergence result means little until you compare it with the same rule minus VPT.
Ignoring the stop. Divergences can fail during long sell-offs. Without a stop, one failed signal can erase months of small wins.
Check the Inputs Too
Mixing exchanges. VPT depends on volume, and volume differs between exchanges. Test and deploy on the same exchange’s data.
Tuning the lookback until it wins. Trying 10, 15, 20 and 30 until SOL turns positive is curve fitting. Log every setting you try. Read our post on the deflated Sharpe ratio before trusting the best one.
Treating VPT like OBV. Both are cumulative volume lines, but VPT weights by price change. Our OBV divergence strategy is a useful second test of the same idea.
Building the VPT Divergence Strategy in Arrow Algo
The drag-and-drop visual builder expresses the rule as a short chain of visual blocks:
- Add the exchange’s candle data and select the four-hour timeframe.
- Connect the close and volume to a VPT block.
- Connect the close to a Min block set to 20. Add a condition block that checks the close is at or below that minimum.
- Connect the VPT output to a second Min block set to 20. Add a condition block that checks VPT is above that minimum.
- Join both with an AND condition block, then add a flat-position check.
- Connect the result to a buy action block. Under your rules, that block sends a signal.
- Build the exits: close above a 20-period EMA, a two-ATR stop, or a time limit. A Position Status block feeding a Since block can count candles in the trade.
- Join the exits with an OR condition block into a sell action block.
Step through a few signals on the chart before trusting the totals. Then duplicate the strategy and delete the VPT condition. Run both on the same data and fee settings.
No deployment is needed for any of this. If you later choose to deploy, your rules signal your own exchange account. The exchange decides whether to execute each order.
What Should You Take Into Your Own Test?
- A VPT divergence strategy buys new price lows only when VPT does not confirm them.
- Buying every new 20-candle low lost money on BTC, ETH and SOL over three years.
- The VPT condition cut about two-thirds of entries and reduced drawdown on every market.
- It improved returns on BTC and ETH but not SOL, with or without a 200 EMA filter.
- Samples were small. Treat VPT divergence as a filter to test, and always run the control.
Disclaimer: This content is for educational purposes only and does not constitute financial advice. Trading involves significant risk and you should only trade with capital you can afford to lose. Past performance is not indicative of future results. Always conduct your own research before making any trading decisions.
Ready to build your own automated trading strategies without writing a single line of code? Start for free at Arrow Algo and join thousands of traders who've made the switch to systematic trading.