
Volume Profile Trading Strategy: How to Build It in Arrow Algo
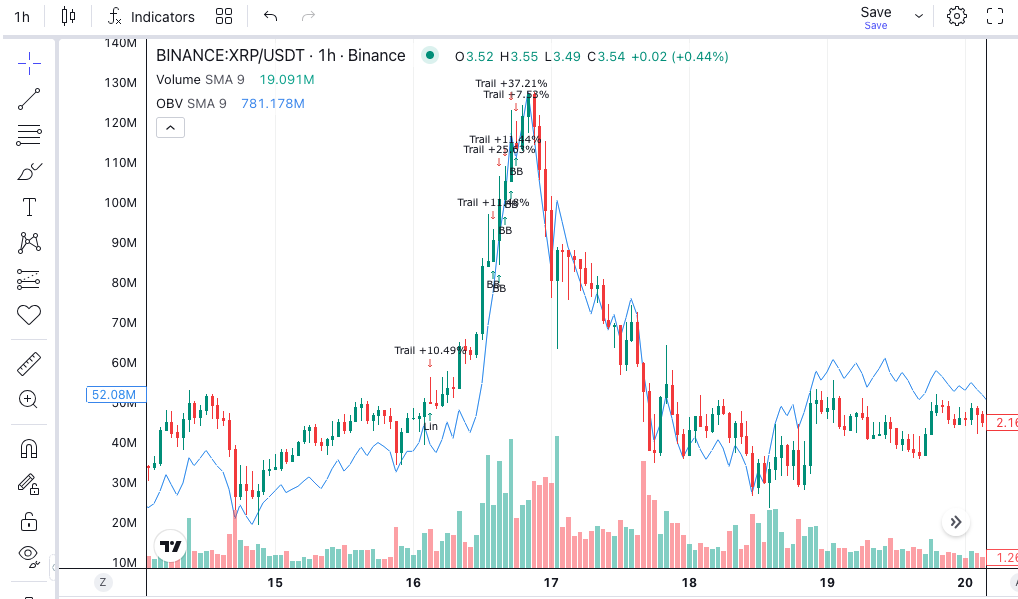
A volume profile trading strategy starts from a simple observation: the levels that matter are not where price turned, but where volume traded. Most support and resistance lines are drawn from swing highs and lows. Volume profile ignores the swings entirely. It asks where the market actually did business, and it treats those prices as the ones worth defending. That shift — from price memory to volume memory — is what makes the tool so useful to systematic traders.
What Does a Volume Profile Actually Show You?
Standard volume bars sit under the chart and measure activity per unit of time. A volume profile rotates the question ninety degrees. It plots a horizontal histogram showing how much volume traded at each price level over a chosen window. Three features of that histogram do most of the work.
The point of control (POC) is the single price with the highest traded volume. It marks the market’s strongest consensus of fair value in that window. The value area contains roughly 70% of all volume, bounded by the value area high (VAH) and value area low (VAL). Inside it, buyers and sellers broadly agreed. Outside it, one side was in control.
Between these landmarks sit high-volume nodes and low-volume nodes. High-volume nodes are prices where the market spent time and built acceptance. Low-volume nodes are prices the market rejected quickly. Price tends to slow down at the first kind and slice through the second. The idea descends from the market profile framework developed at the CBOT in the 1980s, adapted for modern volume data.
Why Volume Levels Beat Drawn Lines
A trendline depends on which highs you connect. Two traders draw two different lines from the same chart. A volume profile is computed from data, which makes it reproducible — the property that matters most for automation. The same inputs always produce the same POC and value area. There is nothing subjective for a backtest to disagree with.
Volume levels also explain why support holds. A high-volume node is a price where thousands of positions were opened. When price returns there, those positions defend their entries. That is real order flow, not chart geometry. It is why a POC retest often produces a cleaner reaction than a textbook trendline touch.
Three Volume Profile Setups Worth Automating
The POC Retest
The workhorse setup. When price trades away from the point of control and later returns to it, the POC often acts as a magnet first and a floor second. The systematic version: enter long when price pulls back to within a small buffer of the POC in an uptrend, with a stop below the value area low. The trend filter is essential. A POC retest against the trend is just catching a falling knife at a popular price.
The Value Area Fade
On quiet, balanced days, price tends to rotate inside the value area. When price pokes above the VAH and fails to hold, it frequently rotates back through the value area toward the VAL — and the reverse from below. The rule set: fade a re-entry into the value area after a failed breakout beyond it, targeting the opposite edge. This is a range strategy, so it needs a regime filter that switches it off when the market starts trending.
The Low-Volume Node Breakout
Low-volume nodes are gaps in acceptance. When price enters one, there is little resting interest to slow it down, so moves through them tend to be fast. The setup: enter in the direction of travel when price breaks into a low-volume node, targeting the next high-volume node beyond it. Breakout traders like this variant because the profile supplies both the trigger level and the target level from the same histogram.
Where Volume Profile Strategies Go Wrong
The most common mistake is using one fixed profile forever. A profile computed over last month says nothing about today’s session structure. Decide deliberately whether your strategy reads a session profile, a weekly composite, or a rolling window — and test that choice.
The second mistake is treating the POC as an exact tick. It is a zone, not a line. Entries need a buffer around it, or the backtest fills on touches that real markets would never give you.
The third is skipping the regime filter. The value area fade loses steadily in trends. The low-volume node breakout bleeds in ranges. Each setup has a native environment, and running it outside that environment is the fastest way to give back its edge.
Building the Strategy in Arrow Algo
Arrow Algo’s Volume Profile block computes the histogram directly from exchange data, so there is nothing to calculate yourself. Drag the block onto the canvas, set the lookback window, and it outputs the key levels — point of control and value area boundaries — as live values your strategy can compare against price.
From there, the setups above become simple visual logic. For the POC retest, connect a condition block that checks price against the POC output, then gate it with a trend filter such as a long-period moving average. For the value area fade, compare price with the VAH and VAL outputs and add an ADX block to switch the strategy off in trends. No code, no formulas — just blocks wired together.
Because the platform backtests on live historical data from Binance, Coinbase, HyperLiquid and other exchanges, the profile your backtest sees is built from the same volume the market actually traded. Run each variant separately, check where it wins and loses, and only then combine them. If you want the full reference on how the indicator itself works, the complete volume profile guide covers it in depth.
What Should You Remember?
- A volume profile trading strategy trades where volume clustered, not where price turned.
- The POC marks consensus fair value. The value area holds roughly 70% of traded volume.
- Three automatable setups: POC retest with trend, value area fade in ranges, low-volume node breakouts.
- Use zones with buffers, not exact ticks, and match each setup to its regime.
- Arrow Algo’s Volume Profile block outputs the levels directly — build the rules visually and backtest before risking anything.
Disclaimer: This content is for educational purposes only and does not constitute financial advice. Trading involves significant risk and you should only trade with capital you can afford to lose. Past performance is not indicative of future results. Always conduct your own research before making any trading decisions.
Ready to build your own automated trading strategies without writing a single line of code? Start for free at Arrow Algo and join thousands of traders who've made the switch to systematic trading.