
VWMA Trend Strategy: Let Volume Confirm the Direction
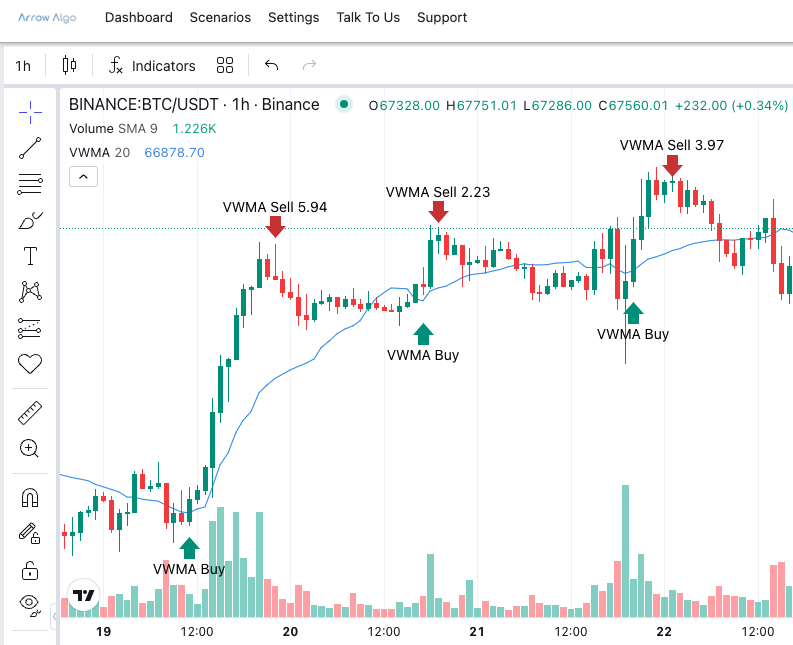
A VWMA trend strategy asks one extra question before it follows a trend. Was the move made on real volume, or did price drift there on thin trade? The Volume Weighted Moving Average answers that by giving heavy-volume candles more say in the average. This guide lays out one testable version of the strategy. Every setting is a starting point for research, not a recommendation. No backtested performance is claimed.
Our Volume Weighted Moving Average complete guide covers the indicator itself. This post is about turning it into trend rules.
Why Should Volume Decide Which Trend You Follow?
A plain moving average treats every candle the same. A candle that printed on a Sunday afternoon with almost no trade counts exactly as much as a candle that printed during a liquidation cascade. That is a strange way to measure where the market agrees on price.
Volume is the market’s vote count. When price rises on heavy volume, more money agreed with the rise. When it rises on light volume, the move is easier to reverse. A trend follower wants the first kind of rise and would rather skip the second.
The VWMA builds that preference into the average. Heavy candles pull it harder. Light candles barely move it. So the VWMA tracks where the volume-weighted consensus is, not just where the last few closes were. Investopedia’s moving average entry describes the plain versions this is built on.
What Does a VWMA Do Differently From a Simple Average?
The calculation is a small change to the simple moving average. Multiply each candle’s close by its volume. Add those products up over the lookback. Divide by the total volume over the same lookback. A 20-period VWMA is the average price of the last 20 candles, weighted by how much traded at each.
Two consequences follow. First, the VWMA and the SMA of the same length share the same inputs, so they can be compared directly. When they differ, volume is the only reason. Second, the VWMA is not the same as VWAP. VWAP resets at the start of each session and accumulates. The VWMA is a rolling window with no reset, so it behaves like a moving average and can be used wherever one would be.
How Do You Read the VWMA Against a Plain SMA?
This comparison is the core of the strategy. Put a 20-period VWMA and a 20-period SMA on the same chart.
VWMA above SMA. The high-volume candles in the window closed higher than the low-volume ones. Buyers showed up in size. The trend has volume behind it.
VWMA below SMA. The heavy candles closed lower. Sellers were the ones trading size. Any rise in price is happening on light volume.
VWMA and SMA together. Volume was spread evenly across up and down candles. No information either way.
The gap between the two lines is a volume-confirmation reading. Its direction matters more than its size. A trend strategy uses it as a filter: only follow a rise when the VWMA sits above the SMA, and only follow a fall when it sits below.
Add Price and Slope
The filter alone is not an entry. Two more conditions complete the trend read. Price should be on the right side of the VWMA. And the VWMA should be sloping the right way, measured as the current value against its value a few candles ago. Price above a rising VWMA that is above its SMA is a volume-confirmed uptrend. All three must agree.
Which VWMA Trend Entries Should Go Head to Head?
Three versions of the entry are worth testing side by side on the same data.
Variation A: price cross with filter. Enter long when the close crosses above the 20-period VWMA, provided the VWMA is above the 20-period SMA and the VWMA is higher than it was five candles ago. This is the simplest version and the baseline to beat.
Variation B: spread expansion. Enter when the VWMA-minus-SMA gap crosses above zero while price is already above both lines. This waits for volume confirmation to arrive after price has moved. Later entries, fewer trades, fewer false starts.
Variation C: dual VWMA. Replace the SMA with a longer VWMA, say 50 periods. Enter when the 20-period VWMA crosses above the 50-period VWMA with price above both. This is a standard crossover with volume weighting on both lines. Our WMA crossover strategy post covers the mechanics of pairing fast and slow periods.
Mirror each variation for the short side. Compare trade count, average holding time, profit factor and the mean without the best trade. Expect A to trade most and B to trade least.
What Should End the Trade?
A trend trade should end when the trend stops, not at a fixed profit. Three exits fit the entry logic.
Filter exit. Close the position when the VWMA drops back below the SMA. The volume confirmation that justified the entry has gone. This is the cleanest exit and the natural partner for Variation A and B.
Price exit. Close when the candle closes below the VWMA. Faster than the filter exit, with more whipsaw.
ATR stop. Place a stop at two ATR below the entry and trail it under the VWMA as the trend develops. This caps the loss on a failed entry while the filter exit handles the winners.
Use the ATR stop in every variation. Then compare the filter exit and the price exit as the profit-taking mechanism. Position size should be a fixed fraction of balance or scaled by the stop distance.
What Breaks a VWMA Trend Backtest?
Volume is exchange-specific. Binance’s volume is not Coinbase’s. The VWMA on one venue will differ from the same setting on another. Backtest on the exchange where the strategy would run.
Liquidation spikes dominate the window. One forced-liquidation candle can carry ten times normal volume. It will drag the VWMA towards its close for the next 20 candles. Decide whether that is the behaviour you want. If not, cap each candle’s weight at some multiple of average volume.
Weekends flatten everything. Crypto trades on Saturday and Sunday on a fraction of weekday volume. The VWMA will almost ignore those candles. That can be an advantage, since weekend moves often reverse. It also means a real weekend break will not register until Monday’s volume arrives.
Lag at turns. The VWMA is still a moving average. It confirms a trend after it has started and keeps you in after it has ended. A tight stop and the filter exit limit the damage. Nothing removes it.
Too few confirmed trends. Requiring three conditions to agree cuts the trade count hard. Check the count before trusting any result. Thirty trades is a sketch, not a test.
Laying Out the VWMA Trend Strategy in Arrow Algo
Each rule maps to a visual block. No code is needed.
- Data Watcher. Set the market and timeframe. A 4-hour chart gives a reasonable number of trend signals.
- VWMA block. Connect close and volume. Set the period to 20.
- SMA block. Connect close. Set the period to 20.
- Lag block. Feed the VWMA output in with a lag of 5. This gives the VWMA’s value five candles ago for the slope check.
- Three comparison blocks. One checks close above VWMA. One checks VWMA above SMA. One checks VWMA above its lagged value.
- AND gate. Combine the three conditions with an AND condition block, set to three inputs.
- Crossover block. For Variation A, add a crossover on close against VWMA and feed it into the AND gate in place of the simple comparison. For Variation B, add a math block that subtracts SMA from VWMA and a crossover against zero.
- Buy action block. Connect it to the AND output. Set size as a percentage of balance.
- Exit rules. Add an ATR block and a stop-loss at two ATR. Add a sell action triggered when VWMA falls below SMA.
Mirror the logic for the short side. Run the backtest on exchange data and open the trade list. Check several entries candle by candle to confirm all three conditions were true at the moment the signal fired.
Once a version has been tested and reviewed, the user decides whether to deploy it. If they do, the rules send buy and sell signals to the user’s own exchange account. The exchange decides whether to accept and execute each order.
What Should Stick
- A VWMA trend strategy follows a trend only when the heavy-volume candles agree with it.
- The VWMA-versus-SMA comparison isolates volume, because both lines share every other input.
- Require price position, volume confirmation and slope together. Compare price-cross, spread-expansion and dual-VWMA entries on the same data.
- Exit when the volume confirmation disappears, with an ATR stop underneath.
- Test on the exchange’s own volume, watch for liquidation spikes and weekend flattening, and check the trade count.
- Every block above exists in Arrow Algo’s visual builder, so the whole test runs without code.
Disclaimer: This content is for educational purposes only and does not constitute financial advice. Trading involves significant risk and you should only trade with capital you can afford to lose. Past performance is not indicative of future results. Always conduct your own research before making any trading decisions.
Ready to build your own automated trading strategies without writing a single line of code? Start for free at Arrow Algo and join thousands of traders who've made the switch to systematic trading.