
WMA Crossover Strategy: How to Build It in Arrow Algo
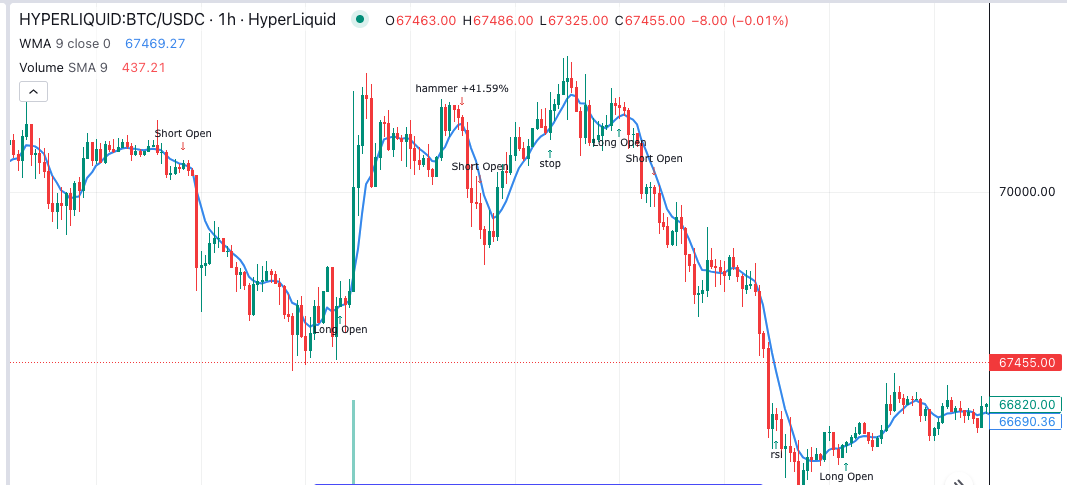
Every WMA crossover strategy makes the same bet: that a weighted moving average will turn a bar or two before a simple one, and that those bars are worth having. The Weighted Moving Average, or WMA, gives the newest candle the most influence and the oldest candle the least. Cross a fast WMA over a slow WMA and you get the classic trend-following signal, delivered earlier than the SMA version. Our Weighted Moving Average guide covers the indicator itself. This post is about the crossover rules and how to test them.
Why Weight the Average Before You Cross It?
A Simple Moving Average treats every bar in its window equally. On a 20-period SMA, the candle from 20 bars ago matters as much as the one that just closed. That is why SMA crossovers arrive late. The average is anchored to old prices.
The WMA fixes this with a linear weighting. On a 20-period WMA the latest close gets a weight of 20. The one before it gets 19. The oldest gets 1. Investopedia’s weighted average explainer walks through the arithmetic. The result tracks current price more closely than the SMA. It is also smoother than price itself, so it still filters noise.
The EMA solves the same problem with an exponential decay. The two behave similarly. The WMA’s weights fall to zero at the edge of the window, so very old bars drop out completely. The EMA never fully forgets. In practice the WMA is often a touch quicker to turn at trend changes, and a touch quicker to whipsaw in chop.
What Makes a WMA Crossover Fire?
The signal is simple. A fast WMA, such as a 10-period, crosses above a slow WMA, such as a 30-period. That is a long signal. The fast line crossing below the slow line is a short or exit signal.
Three things determine how good the signal is:
- The gap between the periods. A 10/30 pair reacts quickly. A 20/100 pair catches only major trends. Wider gaps mean fewer trades and fewer false starts.
- The slope of the slow line. A cross while the slow WMA is still falling is a counter-trend trade. A cross while the slow WMA has already flattened or turned up is a trend trade.
- Where price sits. A bullish cross with price already far above both averages is late. The best crosses happen with price close to the lines.
Which WMA Crossover Setups Deserve a Backtest?
Three variations are worth running side by side. Each adds one filter to the raw cross.
The Plain Two-Line Cross
Go long when the 10 WMA crosses above the 30 WMA. Exit when it crosses back below. No other rules. This is the baseline. Every other version must beat it after costs, or the extra rules are not earning their place.
Expect a low win rate, often 35% to 45%, and a handful of large winners. That is the shape of every trend-following system. Judge it on expectancy, not on how often it is right.
The Slope-Filtered Cross
Take the same cross, but only when the slow WMA is higher than it was five bars ago. This removes most counter-trend crosses inside a falling market. Trade count falls. Average winner usually rises. StockCharts covers why the direction of the slower average matters more than the cross itself.
The Price-Confirmed Cross
Take the cross, then wait for the next candle to close above the fast WMA. This costs one bar of entry. It filters the crosses where price immediately snaps back. It is the version most traders end up running, because it removes the ugliest losers.
How Should You Pair the Fast and Slow Periods?
There is no magic pair. There are sensible ranges.
| Timeframe | Fast WMA | Slow WMA | Character |
|---|---|---|---|
| 15-minute | 9 | 21 | Many trades, needs tight costs |
| 1-hour | 10 | 30 | Balanced for crypto majors |
| 4-hour | 20 | 50 | Swing trades, fewer whipsaws |
| Daily | 20 | 100 | Major trends only |
Test a grid around each pair rather than a single value. If 10/30 works but 9/30 and 11/30 fall apart, the result is noise. A robust pair has neighbours that also work.
Keep the ratio around 1:3 to 1:5. Below 1:2 the lines hug each other and cross constantly. Above 1:6 the slow line barely moves, and the cross becomes a slow-trend filter rather than a signal.
Where Does a WMA Crossover Get Chopped Up?
Sideways markets. There is no polite way to say it. When price oscillates inside a range, the fast WMA crosses the slow WMA repeatedly. Each cross is a small loss. Ten small losses in a row is normal in a two-week range.
Three mistakes make this worse:
- Shortening the periods to catch moves earlier. Faster lines mean more crosses in chop. You trade the problem you were trying to avoid.
- Removing the exit cross. Some traders enter on the cross and exit on a fixed target. That turns a trend system into something else. Test it as a separate strategy, not as a tweak.
- Ignoring fees. A 10/30 WMA on a 15-minute chart might trade 200 times a year. At 0.1% per side, costs eat 40% of capital before any edge shows. Run the backtest with real fees from the start.
A regime filter helps. Only take crosses when the ADX is above 20, or when the slow WMA has moved more than 1% in the last 20 bars. Both rules sit the strategy out in flat markets.
Wiring a WMA Crossover Strategy in Arrow Algo
The whole strategy is five blocks. No code is needed.
- Drag a Data Watcher onto the canvas. Choose the exchange, pair and timeframe, such as BTC/USDT on the 1-hour chart.
- Add two WMA indicator blocks. Set one to period 10 and the other to period 30. Connect the Data Watcher’s close price to both.
- Add a Crossover block. Connect the fast WMA to the first input and the slow WMA to the second. Its output fires once when the fast line crosses above the slow line.
- Connect that output to a Buy action block. Set the position size.
- Add a second Crossover block with the inputs reversed. Connect it to a Sell action block for the exit.
For the slope filter, add a Lag block on the slow WMA set to five bars. Feed the current WMA and the lagged WMA into a Condition block set to “greater than”. Use a second Condition block with the AND operator to combine that with the crossover before it reaches the Buy block.
Backtest on at least two years of data. Then open the trade list and look at the losing streaks. If the longest streak is more than you could sit through live, widen the periods or add the regime filter and run it again.
What Should Survive Into Your Rules?
- A WMA crossover strategy fires earlier than the SMA version because recent bars carry more weight.
- Earlier also means more false signals in ranges. The slope and price-confirmation filters cut the worst of them.
- Keep the fast-to-slow ratio between 1:3 and 1:5, and test the neighbours of any pair that works.
- Costs decide whether a fast crossover is viable. Include real fees before judging the result.
- In Arrow Algo the baseline is five blocks. Add filters one at a time and backtest each change on its own.
Disclaimer: This content is for educational purposes only and does not constitute financial advice. Trading involves significant risk and you should only trade with capital you can afford to lose. Past performance is not indicative of future results. Always conduct your own research before making any trading decisions.
Ready to build your own automated trading strategies without writing a single line of code? Start for free at Arrow Algo and join thousands of traders who've made the switch to systematic trading.