Walk-forward analysis is the most reliable method for validating an algorithmic trading strategy before risking real capital. Unlike a standard backtest — which tests your strategy on data you already used to build it — walk-forward analysis tests it on data it has never seen. That single difference separates strategies that actually work from strategies that only appeared to work in hindsight.
What Is Walk-Forward Analysis?
Walk-forward analysis is a backtesting method that splits historical price data into sequential windows. Each window has two parts: an in-sample period and an out-of-sample period. In-sample data is the data you use to optimise your strategy’s parameters. Out-of-sample data is the data you then test on — data the strategy had no part in shaping.
You start with the earliest window, optimise your parameters on the in-sample portion, then record the strategy’s performance on the out-of-sample portion. You then move — or “walk” — the window forward in time, repeat the process, and collect results across all windows. The final performance figure comes from combining only the out-of-sample results.
Because the out-of-sample periods were never used to tune the strategy, the combined result gives you a realistic estimate of how the strategy would have performed in live trading.
Why Does Walk-Forward Analysis Matter?
Standard backtests have a serious flaw: you can always make a strategy look better by adjusting its parameters until they fit the historical data perfectly. That process is called overfitting — or curve fitting. Overfitted strategies perform brilliantly in backtests and collapse in live trading.
Walk-forward analysis solves this. The out-of-sample periods act as a proxy for the future. A strategy that holds up across multiple out-of-sample windows has demonstrated robustness, not just a perfect fit to one fixed dataset.
This is why walk-forward analysis is the standard validation method for professional systematic traders. It answers the question a standard backtest cannot: does this strategy generalise, or did it just memorise the past?
How Does Walk-Forward Analysis Work in Practice?
The process follows five steps.
Step 1: Define your window sizes. Choose an in-sample length and an out-of-sample length. A common ratio is 70% in-sample to 30% out-of-sample — for example, 70 days of optimisation followed by 30 days of testing.
Step 2: Optimise on the in-sample window. Run your parameter optimisation on the in-sample data. Find the settings that produced the best risk-adjusted returns in that period.
Step 3: Test on the out-of-sample window. Apply those optimised parameters to the following out-of-sample period. Record the results without any further adjustment.
Step 4: Walk the window forward. Shift both windows forward in time — typically by the length of the out-of-sample period. Repeat steps 2 and 3 on the new windows.
Step 5: Combine out-of-sample results. String together all out-of-sample results in chronological order. This combined equity curve is your walk-forward result — the only number that matters for assessing real-world robustness.
What Does a Walk-Forward Result Tell You?
A strong walk-forward result shows consistent performance across multiple out-of-sample windows. No single window dominates. Drawdowns stay within acceptable bounds in most periods. The equity curve trends upward even when individual windows underperform.
A weak result reveals the opposite. Performance concentrates in one or two windows. Other windows show losses or flat results. The overall curve masks deep inconsistency across different market conditions.
One useful metric is the walk-forward efficiency ratio — the ratio of out-of-sample performance to in-sample performance. A ratio above 0.5 suggests the strategy generalises reasonably well. A ratio close to 0 or negative means the strategy is overfitted: the real-world performance is a fraction of what the in-sample results implied.
What Are Common Walk-Forward Analysis Mistakes to Avoid?
Using too small an out-of-sample window. A 5-day out-of-sample window contains too little data to draw meaningful conclusions. Use windows large enough to capture a variety of market conditions — at least 20 to 30 trading days.
Re-optimising between windows without discipline. The point of walk-forward analysis is to use only in-sample data for optimisation. Peeking at out-of-sample results to guide parameter choices defeats the purpose entirely.
Ignoring individual window results. Always examine each window separately, not just the combined result. Consistent performance across windows is far more meaningful than a single strong combined figure driven by one exceptional period.
Treating one successful walk-forward as final proof. A single walk-forward test on one asset and one timeframe is a starting point, not a conclusion. Test across multiple assets and timeframes before committing a strategy to live trading.
How to Run Walk-Forward Analysis in Arrow Algo
Arrow Algo now includes walk-forward analysis as a built-in feature — no external tools or spreadsheets required.
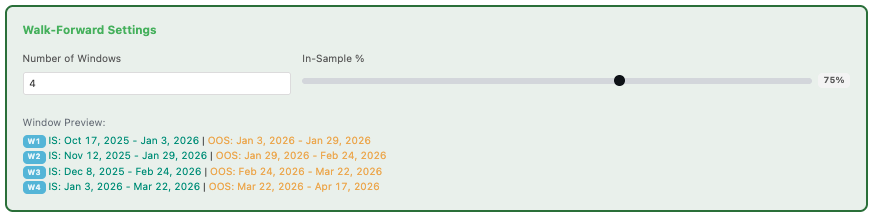
Build your strategy using the visual block builder as normal. Set your entry rules, exit conditions, and risk parameters using drag-and-drop blocks. When you are ready to validate, open the walk-forward analysis panel. Define your in-sample and out-of-sample window lengths, select your parameter ranges, and run the analysis.
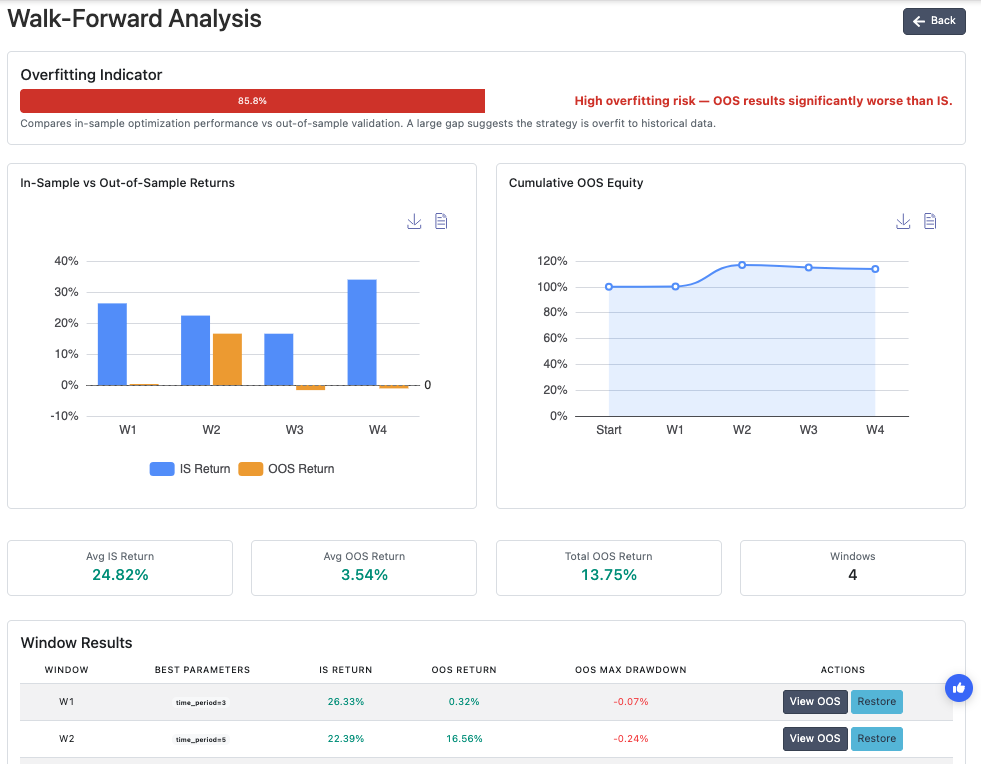
Arrow Algo automatically steps through each window, optimises on the in-sample data, tests on the out-of-sample data, and combines the results into a single walk-forward equity curve. The results panel shows performance by window alongside the combined out-of-sample curve — giving you a clear view of both consistency and overall robustness.
Because Arrow Algo connects directly to live historical data from exchanges like Binance, Coinbase, and HyperLiquid, the walk-forward test runs on the same data your strategy would have traded in real conditions — not a preprocessed third-party dataset.
Pair walk-forward analysis with the trade filter techniques covered here to build strategies that are both well-validated and precisely defined. Or start building and testing at Arrow Algo today.
What Are the Key Takeaways?
- Walk-forward analysis tests your strategy on data it never influenced — the only honest measure of out-of-sample performance
- It prevents overfitting by separating the data used to optimise parameters from the data used to evaluate results
- Each window produces an independent out-of-sample result; consistency across windows signals true robustness
- The walk-forward efficiency ratio compares out-of-sample to in-sample performance — aim for a ratio above 0.5
- Arrow Algo now includes walk-forward analysis as a built-in feature — no coding or external tools required
- Test across multiple assets and timeframes before treating any walk-forward result as conclusive
Disclaimer: The information provided in this article is for educational purposes only and does not constitute financial advice. Trading involves significant risk and you should only trade with capital you can afford to lose. Past performance is not indicative of future results. Always conduct your own research before making any trading decisions.
Ready to build your own automated trading strategies without writing a single line of code? Start for free at Arrow Algo and join thousands of traders who’ve made the switch to systematic trading.