
Z-Score Trading Strategy: One Rule for Every Market
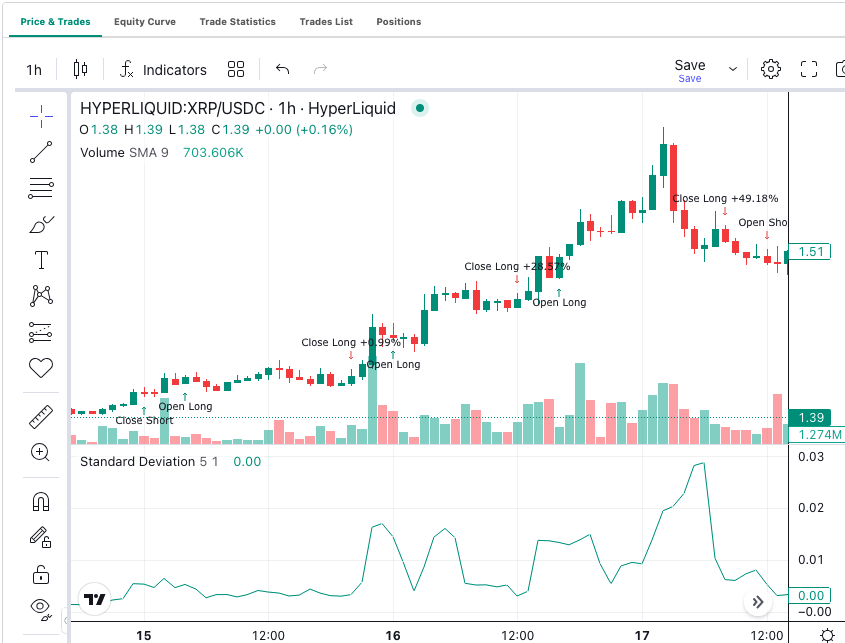
A z-score trading strategy answers a question every mean-reversion trader asks differently for every market: how far is too far? Bitcoin $3,000 below its 20-day average might be ordinary. Ether $300 below its average might be extreme. A z-score puts both on the same scale, so one rule can serve every chart.
This post explains what the z-score measures and how to turn price into one. It then covers which thresholds to test and where the approach breaks down.
What Is a Z-Score Trading Strategy?
A z-score trading strategy is a mean-reversion approach that measures how many standard deviations price sits from its recent average. The z-score is that standardised distance. A reading of -2 means price is two standard deviations below the mean. A reading of +2 means two above.
The statistic comes from basic statistics, where it is called the standard score. Investopedia explains the general concept. Applied to trading, the mean is usually a simple moving average. The deviation is the standard deviation over the same window.
The strategy buys when the z-score drops below a negative threshold. It sells when the z-score returns towards zero. Shorts mirror it.
Why Z-Score Trading Strategies Matter
Most mean-reversion rules are written in price terms. “Buy when price is 3% below the 20-day average.” That rule means something different on a quiet market and a volatile one. A 3% dip in a major pair is a shock. A 3% dip in a small altcoin is Tuesday.
The z-score removes that problem. It divides the distance by the market’s own recent volatility. The threshold adapts automatically. When volatility rises, the same z-score requires a bigger price move. When volatility falls, a smaller move qualifies.
That gives three practical benefits. One rule works across assets. The same rule keeps working as a market’s volatility regime changes. And results across markets can be compared, because every entry was triggered by the same standardised condition.
If you already use Bollinger Bands, you already use a z-score. A touch of the lower band at 2 standard deviations is a z-score of exactly -2. Bollinger’s own site describes the bands this way. The z-score simply shows the number, so you can set thresholds other than the band width.
How Do You Turn Price Into a Z-Score?
Three steps, all available as visual blocks.
- Calculate a simple moving average of the close over a lookback window, such as 20 candles.
- Calculate the standard deviation of the close over the same window.
- Subtract the average from the current close. Divide the result by the standard deviation.
The output is the z-score for the current candle. It updates every candle as the window rolls forward.
The lookback window matters. Twenty candles gives a responsive reading that reacts to recent swings. Fifty candles gives a slower, steadier mean that suits longer holding periods. Our standard deviation guide covers how window length changes the deviation itself.
Use the same window for both the average and the deviation. Mixing a 20-period mean with a 50-period deviation produces a number that is not a true z-score.
Which Thresholds Should Trigger an Entry and Exit?
The common starting point is an entry at -2 and an exit at 0. Price has stretched two deviations below the mean. The trade closes when price returns to the mean.
Under a normal distribution, a z-score beyond plus or minus 2 occurs about 5% of the time. Market returns are not normally distributed. Extreme readings occur far more often than the textbook predicts. Our fat tail risk guide explains why. A z-score of -3 is not a once-a-decade event in crypto. It happens regularly.
That has two consequences for thresholds. First, -2 may be too early. Test -2.5 and -3 as well. Second, never assume a reading cannot go further. Price at -3 can go to -5. A stop or a maximum-hold timer is essential.
For exits, zero is clean but slow. An exit at -0.5 gives up some of the move but closes faster. Some traders exit at +0.5, accepting a longer hold for a bigger average win. Backtest the combinations rather than picking one from theory.
When Does a Z-Score Entry Fail?
The z-score assumes the mean is stable enough to revert to. In a strong trend it is not. Price can sit at -2 for weeks while the moving average chases it lower. Every entry fails and the strategy bleeds.
A trend filter solves most of this. Only take long entries when a slower trend measure is flat or rising. A 200-period moving average or an ADX reading below 25 both work. The mean reversion vs trend following guide covers how to decide which regime a market is in.
Volatility clusters create a second failure. A sudden crash inflates the standard deviation. The z-score shrinks even though price has not recovered, because the denominator jumped. The strategy reads a calm market where there is a crisis. A longer window reduces this effect but slows every other reaction.
Finally, low-liquidity pairs produce noisy z-scores. A single wick can swing the deviation. Stick to liquid markets, or use a longer window.
How to Apply a Z-Score Trading Strategy in Arrow Algo
Arrow Algo’s no-code visual builder has every block the calculation needs.
- Add a data watcher for your pair and timeframe.
- Connect its close to a Simple Moving Average block and a Standard Deviation block. Set both to 20.
- Add a Math Operation block set to subtract. Connect the close as A and the moving average as B.
- Add a second Math Operation block set to divide. Connect the subtraction result as A and the standard deviation as B. This output is the z-score.
- Add a condition block: z-score less than a fix number block set to -2. Connect its true output to a Buy block.
- Add a second condition: z-score greater than a fix number set to 0. Connect it to a Sell block.
To add the trend filter, connect a 200-period moving average and a second condition requiring close above it. Combine the two entry conditions in an AND block before the Buy block.
Run a backtest on live historical exchange data. Then change only the entry threshold and run again. Because the z-score is standardised, you can apply the identical strategy to a second pair and compare the results directly.
What Are the Key Takeaways?
- A z-score measures distance from the mean in standard deviations, so one threshold works on any market.
- Build it from a moving average, a standard deviation and two math blocks. Use the same window for both.
- Start with entry at -2 and exit at 0, then test wider entries. Crypto exceeds plus or minus 2 far more often than theory predicts.
- Add a trend filter. Z-score entries lose money in sustained trends.
- Always pair the entry with a stop or a time limit. A stretched reading can stretch further.
Disclaimer: This content is for educational purposes only and does not constitute financial advice. Trading involves significant risk and you should only trade with capital you can afford to lose. Past performance is not indicative of future results. Always conduct your own research before making any trading decisions.
Ready to build your own automated trading strategies without writing a single line of code? Start for free at Arrow Algo and join thousands of traders who've made the switch to systematic trading.