When it comes to technical analysis in trading, identifying the direction and strength of a trend is crucial for making informed decisions. One of the tools that traders often use to achieve this is the Linear Regression Slope indicator. While it may sound complex, the concept behind it is straightforward and can be incredibly useful for both novice and experienced traders. In this blog post, we’ll break down what the Linear Regression Slope is, how it works, and how you can use it to enhance your trading strategy—especially when integrated with platforms like Arrow Algo.
What is the Linear Regression Slope?
The Linear Regression Slope is a trading indicator derived from the statistical method of linear regression, which is used to model the relationship between two variables. In trading, these variables are typically time and price. The Linear Regression Slope specifically measures the angle of the linear regression line that best fits the price data over a specified period. This slope indicates the rate of change in price and helps traders identify the strength and direction of a trend.
How Does the Linear Regression Slope Work?
Linear Regression Line: The first step in understanding the Linear Regression Slope is to know about the linear regression line. This line is calculated by plotting a series of price points over a certain period and finding the line that best fits these points. The linear regression line is essentially a straight line that minimises the distance between itself and all the data points.
Calculating the Slope: The slope of the linear regression line is calculated to determine how steep the line is. In mathematical terms, the slope is the “rise over run,” meaning it shows how much the price changes for each unit of time. A positive slope indicates that the price is rising over time (uptrend), while a negative slope indicates that the price is falling (downtrend).
Interpreting the Slope:
- Positive Slope: When the slope is positive, it indicates that the market is in an uptrend. The steeper the slope, the stronger the uptrend.
- Negative Slope: A negative slope indicates a downtrend. The steeper the slope, the stronger the downtrend.
- Slope Near Zero: A slope close to zero suggests a flat or sideways market, where there is little to no trend.
Incorporating Linear Regression Slope in Arrow Algo: A Practical Example
Let’s take a practical example using Arrow Algo, a no-code platform that allows traders to build, backtest, and run automated trading strategies.
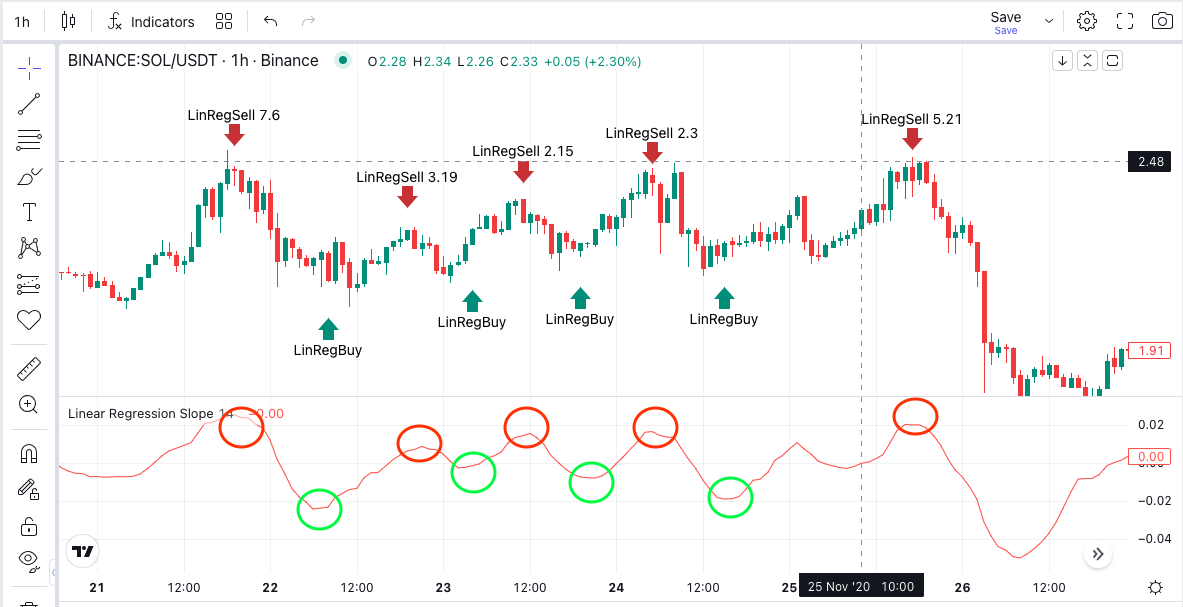
In this example, we’re using the Linear Regression Slope indicator with the 4-hour closing price of Solana/USDT. The values generated by the Linear Regression Slope indicator are then fed into lag blocks and condition blocks within Arrow Algo. This setup enables us to monitor whether the Linear Regression Slope is rising or falling, and crucially, to detect changes in direction at the top and bottom of price swings.
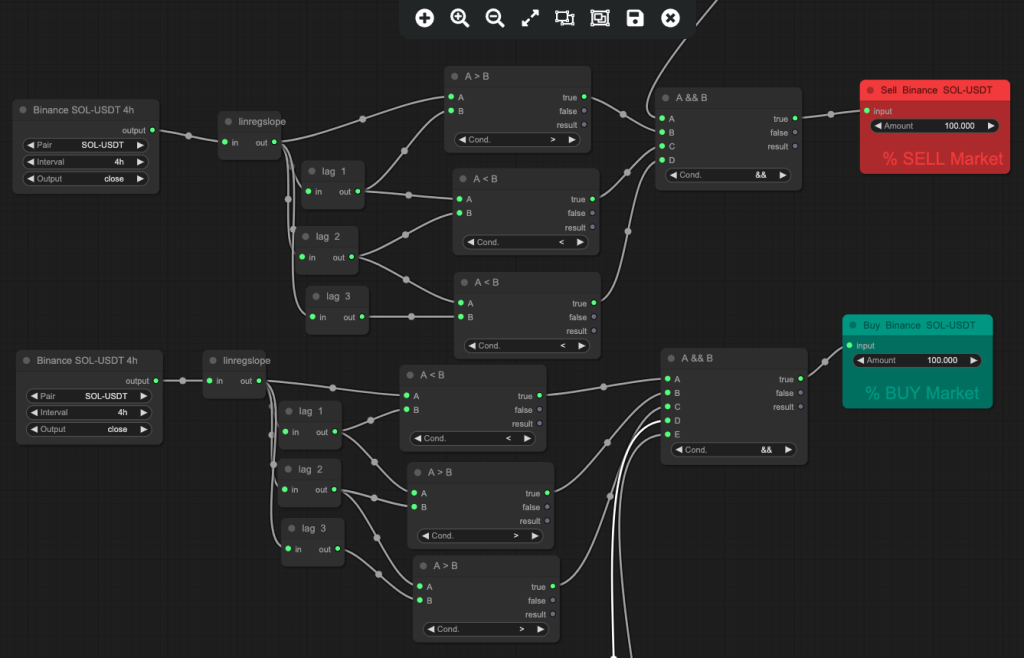
Why This Setup Works:
Lag Blocks: These blocks help in smoothing out the data, providing a clearer picture of the trend’s direction over time. By analyszing the lagged values of the slope, you can determine if a trend is gaining or losing momentum.
Condition Blocks: These blocks allow you to set specific conditions for entering or exiting trades. For instance, you can create a condition where a buy signal is triggered if the slope starts to rise after being negative, indicating a potential uptrend.
With this setup in Arrow Algo, you can effectively automate your trading strategy, ensuring that you capitalize on trends while minimising the risks associated with emotional decision-making.
Why is the Linear Regression Slope Important?
The Linear Regression Slope is a valuable tool because it provides a clear visual representation of the trend’s strength and direction. It is particularly useful in the following ways:
- Trend Confirmation: Traders often use the Linear Regression Slope to confirm the direction of a trend. If other indicators suggest a trend, the slope can validate its strength.
- Identifying Reversals: If the slope begins to decrease in magnitude or changes direction, it could signal a potential trend reversal, alerting traders to adjust their positions.
- Filtering Trades: The Linear Regression Slope can be used in conjunction with other indicators to filter out false signals. For instance, a trader might only enter trades in the direction of the slope, reducing the likelihood of making trades against the prevailing trend.
Using the Linear Regression Slope in Your Trading Strategy
To effectively incorporate the Linear Regression Slope into your trading strategy, consider the following steps:
- Set the Time Period: Determine the time period for which you want to calculate the slope. Shorter periods will be more sensitive to recent price changes, while longer periods will smooth out the noise and focus on the broader trend.
- Combine with Other Indicators: The Linear Regression Slope works best when combined with other indicators, such as moving averages or the Relative Strength Index (RSI). This can help you confirm signals and make more informed trading decisions.
- Monitor the Slope: Regularly monitor the slope for changes in its direction or steepness. A flattening slope may indicate that a trend is losing strength, while a steepening slope may suggest that the trend is gaining momentum.
- Backtest Your Strategy: Before using the Linear Regression Slope in live trading, backtest your strategy to see how it would have performed in past market conditions. This can give you confidence in your approach and help you refine your strategy.
Maximizing Your Trading Edge with Linear Regression Slope
The Linear Regression Slope is a powerful yet simple tool that can significantly enhance your trading strategy by helping you identify and confirm trends. By integrating this indicator into platforms like Arrow Algo, you can automate your strategy, reducing the risks of emotional trading and increasing your chances of success. Whether you’re a beginner looking to grasp the basics of trend analysis or an experienced trader seeking to refine your strategy, the Linear Regression Slope is a valuable addition to your technical analysis toolkit.
Happy trading!
Did you enjoy this? You may like:
Leave a Reply