
AI Backtest Analysis: Ask Why Your Strategy Lost
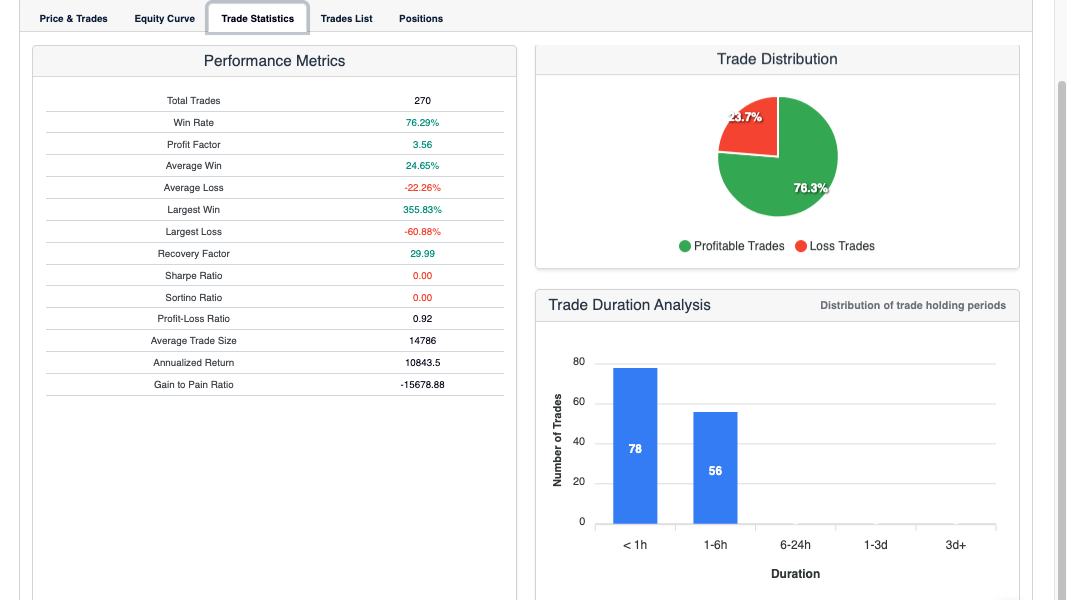
AI backtest analysis turns a finished report into a conversation. Instead of reading twenty metrics and guessing what they mean together, you ask. “Why did this lose in March?” is a question a report cannot answer. An assistant with access to the trades can.
Our earlier post on AI backtesting covered how to phrase the request that runs the test. This one starts after the test has finished. The report is on screen, and some of the numbers worry you.
What Is AI Backtest Analysis?
AI backtest analysis is the use of an AI assistant to interpret a completed backtest, metric by metric and trade by trade. The assistant reads the same report you see. It can also pull the order list, the signal history and the indicator values at any candle. Then it answers questions in plain language.
The assistant does not change the strategy or the data. The rules remain visual blocks on a canvas. The history remains the exchange’s own record. What changes is the speed at which you can move from “that number looks bad” to “here is the reason”.
In Arrow Algo this works through a connector built on the Model Context Protocol, an open standard that lets assistants such as Claude, ChatGPT and Grok use outside tools.
Why Does Conversational Analysis Beat Skimming a Report?
A report presents every metric with equal weight. Your eye goes to total return, then to win rate, and the rest blurs. The problem is that the metrics only make sense in relation to each other.
A Sharpe ratio of 1.4 looks fine. It looks different once you learn that the strategy made 11 trades. A 70% win rate looks great. It looks different next to an average loss three times the size of the average win.
An assistant holds all the numbers at once and reports the tensions between them. That is the part humans skip when they are tired or hopeful. Our guide on how to read a backtest report lists what each metric means. The conversation is where you find out what they mean together.
Which Questions Get Useful Answers?
Three metrics cause the most confusion. Each has a question that turns it from a number into a decision.
Sharpe Ratio
Sharpe divides average excess return by the volatility of returns. Investopedia’s definition covers the formula. The useful question is not “is 1.4 good?” It is “how much of this Sharpe comes from the best five trades?” If the answer is most of it, the ratio describes luck.
Maximum Drawdown
Drawdown is the largest peak-to-trough fall in equity. The number alone hides its shape. Ask “how long did the drawdown last, and was I in a position for all of it?” A 20% fall that recovers in three weeks is a different experience from one that lasts five months.
Profit Factor
Profit factor is gross profit divided by gross loss. A reading of 1.8 means winners earned 1.8 times what losers cost. Ask “what is the profit factor if I remove the single largest winner?” Our profit factor guide explains why that one subtraction matters so much.
“Why Did This Lose in March?” Tracing One Bad Month
This is where AI backtest analysis earns its place. Suppose the equity curve shows a clean rise, then a slump through March, then recovery. You want to know what March did differently.
Ask the assistant to list every trade that opened or closed in March. Then ask it to show the indicator values at each entry. Three explanations usually emerge, and they call for different responses.
The market changed. Price chopped sideways and a trend-following rule kept entering and getting stopped out. This is regime behaviour. The fix is a filter that recognises chop, not a tweak to the entry.
A rule did something you did not intend. The exit fired on an unfinished candle, or a condition evaluated before the indicator had enough history. This is a build error. The trace at the exact candle shows it.
Costs ate the edge. The trades were right but small, and fees and slippage turned them negative. Ask for the gross and net result per trade in March. If gross is positive and net is negative, the strategy is correct and too frequent.
The point of the exercise is to classify the month, not to fix March. Patching the rules until March looks good is the fastest route to an overfitted strategy.
When Should You Distrust the Explanation?
An assistant produces fluent explanations. Fluency is not evidence. Four habits keep the analysis honest.
- Ask for the numbers behind the claim. “The strategy struggled in choppy conditions” should come with the trade IDs and the ATR or ADX values that define choppy.
- Check one answer against the report yourself. If the assistant says the profit factor is 1.8 and the report says 1.3, stop and find out why before reading further.
- Watch for stories that fit any outcome. “Volatility was elevated” explains a losing month and a winning one equally well. That makes it useless.
- Separate explanation from prescription. Knowing why March lost does not tell you what to change. Treat any proposed rule change as a new hypothesis for an untouched test period.
The assistant reads what the report contains. It cannot see the trades you would have taken under different rules, or the data you never tested on. Keep those limits in mind and the tool is valuable. Forget them and it becomes a confident narrator.
How to Apply AI Backtest Analysis in Arrow Algo
Connect your assistant to Arrow Algo through the connector. Then run the conversation in this order:
- Ask for the headline metrics of a named backtest and the three weaknesses the assistant would worry about most.
- Pick the worst period on the equity curve. Ask for the trades in that window and the indicator readings at each entry and exit.
- Ask for the candle-by-candle trace around one specific trade that looks wrong. This shows every block’s value at that moment.
- Ask for the strategy’s recorded findings, which hold the notes and weaknesses logged from earlier tests.
- If a change seems justified, ask for a walk-forward run rather than a re-test on the same data. That keeps the fix honest.
Every step uses the same no-code strategy you built with visual blocks. Nothing is deployed, and no exchange account is touched. If you later choose to deploy, your rules signal your own exchange account and the exchange decides whether to execute.
What Are the Key Takeaways?
- AI backtest analysis interprets a finished report in conversation. It does not alter the strategy or the data.
- Metrics only make sense together. Ask how Sharpe, drawdown and profit factor change when the best trades are removed.
- A bad month has three usual causes: regime change, a build error, or costs. Classify it before changing anything.
- Demand the numbers behind every explanation, and verify one against the report yourself.
- Treat any proposed fix as a new hypothesis for untouched data, never as a patch for the month that hurt.
Disclaimer: This content is for educational purposes only and does not constitute financial advice. Trading involves significant risk and you should only trade with capital you can afford to lose. Past performance is not indicative of future results. Always conduct your own research before making any trading decisions.
Ready to build your own automated trading strategies without writing a single line of code? Start for free at Arrow Algo and join thousands of traders who've made the switch to systematic trading.