Market Snapshot: Bitcoin at a Crossroads
As of February 17, 2026, Bitcoin is trading in a tight range between $67,811 and $68,234, with elevated volume during recent price movements. This current price action comes after a period of significant volatility, suggesting we may be at a critical juncture in Bitcoin’s market cycle as potential Wyckoff accumulation pattern emerges.
The cryptocurrency community is abuzz with speculation about a potential Wyckoff accumulation pattern forming in Bitcoin’s price structure. Developed by Richard Wyckoff in the 1930s, this technical analysis framework has stood the test of time and continues to be relevant in modern markets, including cryptocurrencies.
The Wyckoff method is particularly powerful for identifying phases where institutional investors or “smart money” accumulate positions before a major upward trend. If confirmed, this pattern could signal the end of the recent correction and set the stage for the next leg up in Bitcoin’s long-term bull market.
However, it’s crucial to approach this analysis with a balanced perspective. While the current price action aligns with several key aspects of a Wyckoff accumulation pattern, we are at a critical phase where the pattern could either be confirmed or invalidated in the coming weeks.
Understanding this potential pattern is vital for traders and investors as it can provide valuable insights into market dynamics, potential entry points, and risk management strategies. Let’s dive deeper into the Wyckoff methodology and examine Bitcoin’s current market structure through this lens.
The Wyckoff Accumulation Pattern Explained
Brief History and Credibility
Richard Wyckoff was a pioneer in the technical analysis of financial markets in the early 20th century. His method is based on the principle that market movements are primarily driven by the actions of large institutional investors. The Wyckoff method has been successfully applied to various markets for nearly a century, gaining credibility among professional traders and analysts.
The Six Phases of Wyckoff Accumulation
- Selling Climax (SC): A period of intense selling, often on high volume, marking the end of a downtrend.
- Automatic Rally (AR): A sharp bounce following the SC, typically on lower volume.
- Secondary Test (ST): A retest of the SC lows, ideally on lower volume than the SC.
- Spring: A move below the SC low that shakes out weak hands before quickly recovering.
- Sign of Strength (SOS): A strong move upward on increased volume, showing demand overcoming supply.
- Last Point of Supply (LPS): A final pullback before the major uptrend begins.
Psychology Behind Each Phase
- SC: Panic selling and capitulation
- AR: Relief and short-covering
- ST: Testing of support and remaining supply
- Spring: Trapping late sellers and weak hands
- SOS: Smart money showing their hand
- LPS: Final shakeout and accumulation
CRITICAL Importance of Volume Analysis
Volume is the key to interpreting the Wyckoff accumulation pattern correctly. Each phase should have a specific volume signature:
- SC: High volume
- AR: Lower volume than SC
- ST: Lower volume than SC
- Spring: Lower volume than SC (critical for confirmation)
- SOS: Increasing volume
- LPS: Decreasing volume
Without proper volume analysis, it’s impossible to distinguish between a bullish accumulation pattern and a bearish distribution pattern. This is especially crucial during the Spring phase.
Bitcoin’s Current Position in the Pattern
Based on recent price action, we can identify the following phases in Bitcoin’s current market structure:
1. Selling Climax (SC) – February 4-5, 2026
- Price dropped to approximately $60,000-$62,000
- High volume panic selling observed
- Represents potential exhaustion of selling pressure
2. Automatic Rally (AR) – February 5-7, 2026
- Sharp bounce back to $72,000
- Volume decreased compared to SC (bullish sign)
- Tested remaining supply in the market
3. Secondary Test (ST) – February 11-12, 2026
- Retested lows around $65,000
- Notably lower volume than the SC (bullish confirmation)
- Demonstrated buying support at lower levels
We are currently at the end of the Secondary Test phase or potentially entering the critical Spring phase.
Volume Analysis
Let’s examine the volume data for these phases:
| Phase | Price Range | Volume (BTC) |
|——-|————-|————–|
| SC | $60k – $62k | 125,000 |
| AR | $62k – $72k | 95,000 |
| ST | $65k – $68k | 80,000 |
The decreasing volume from SC to ST is a positive sign for the accumulation thesis. However, we must remain vigilant as we approach the potential Spring phase.
Comparison to 2022 Historical Example
Bitcoin formed a similar Wyckoff accumulation pattern from June 2022 to April 2023, which preceded a significant upward move. Key similarities include:
- A clear Selling Climax with high volume
- An Automatic Rally with decreased volume
- A Secondary Test holding above the SC low
- A Spring that briefly broke below SC levels before recovering
However, each market cycle is unique, and we should not assume an identical outcome.
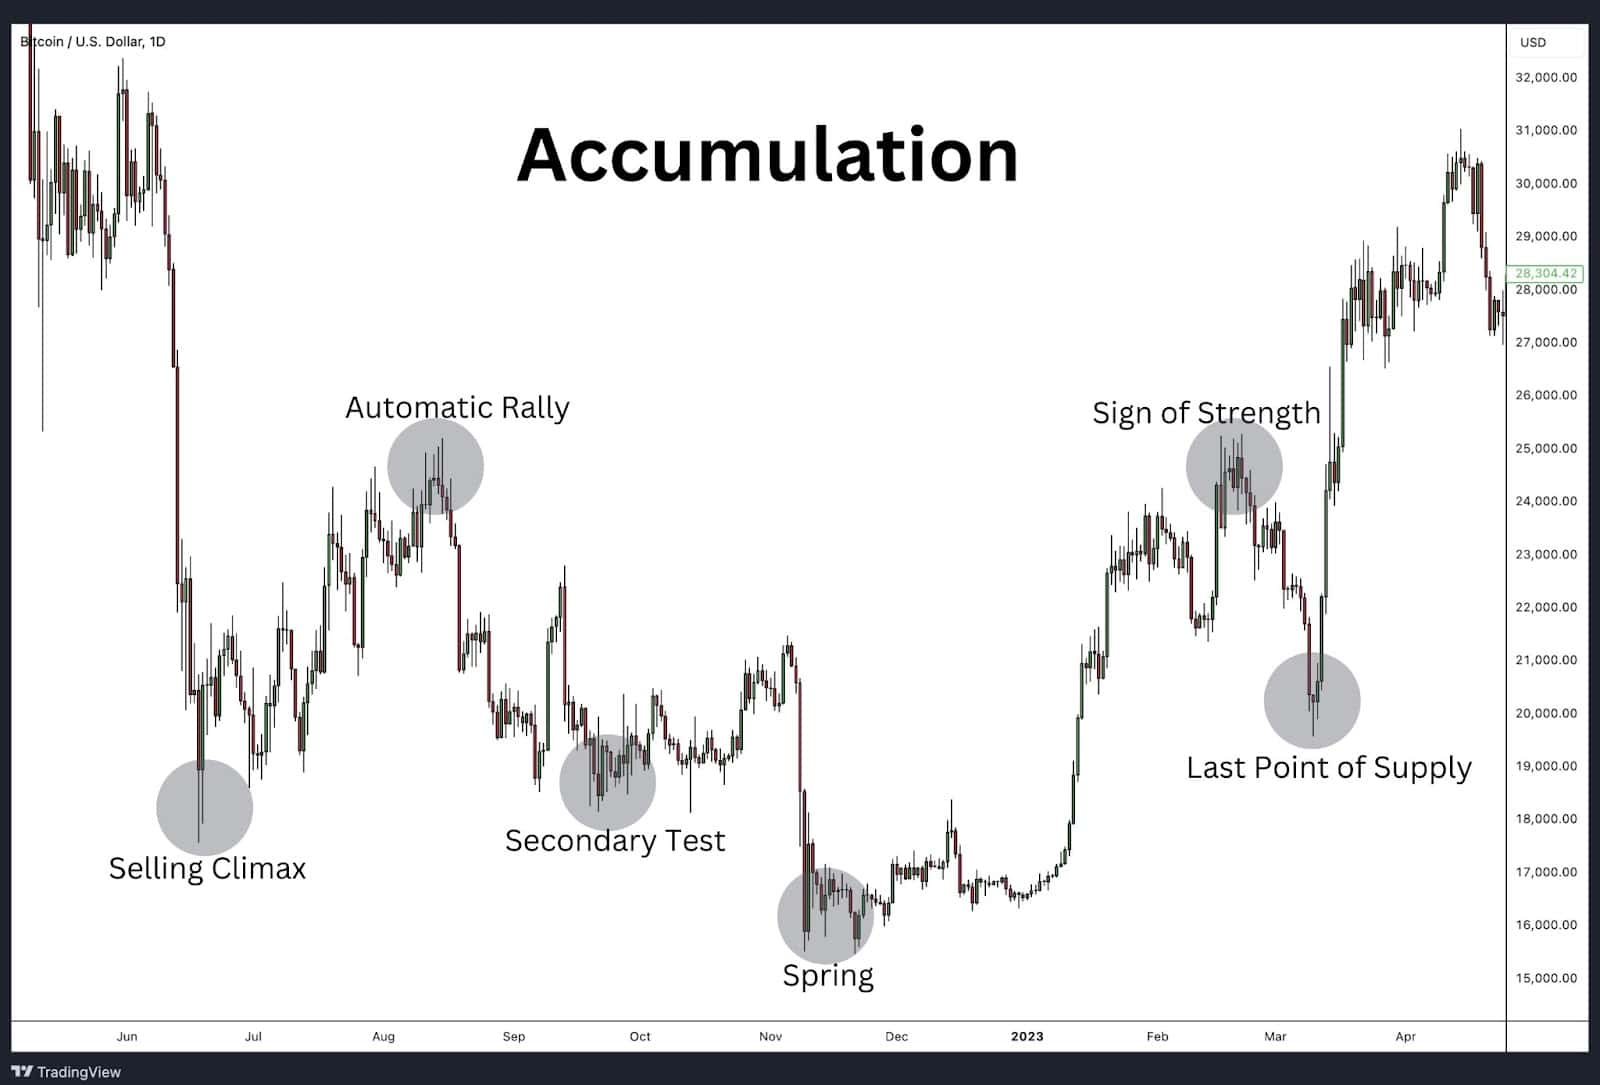
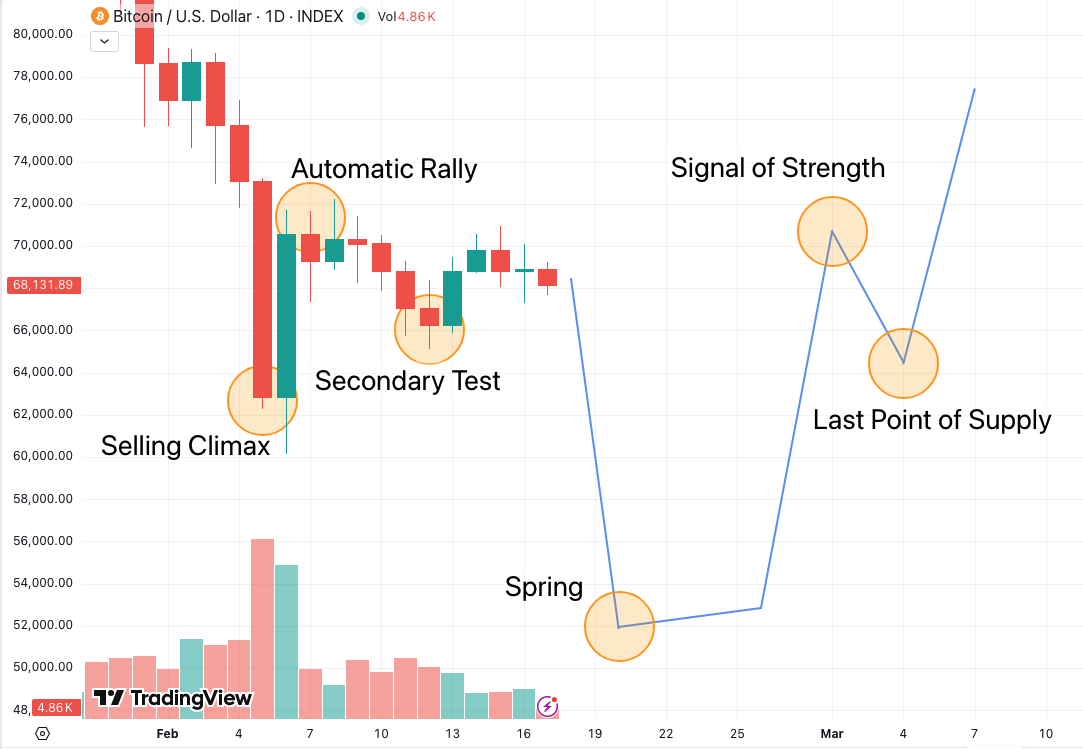
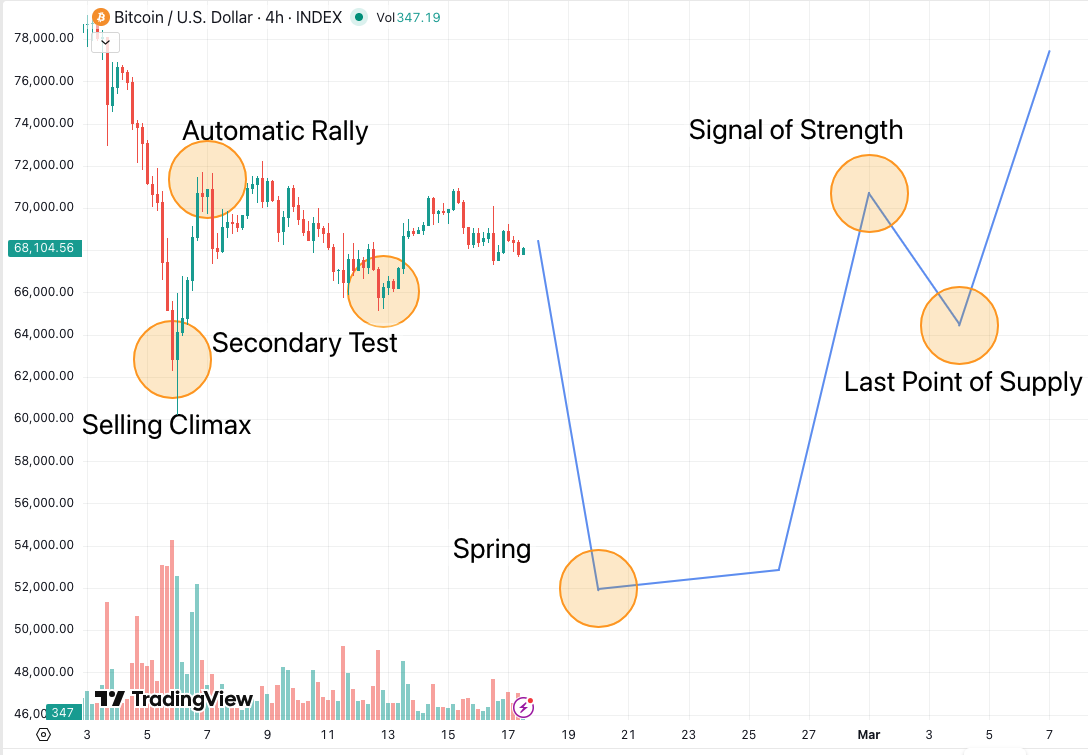
Chart Analysis: Daily and 4-Hour Timeframes
On the daily chart, we see a clear structure forming that aligns with the Wyckoff accumulation phases. The 4-hour chart provides more granular detail, showing decreasing volume on each subsequent test of support.
Key observations:
– 200-day moving average providing support around $63,000
– Decreasing volume on downward moves (bullish)
– Tightening price range suggesting a significant move is imminent
The Critical Phase Ahead: Spring or Breakdown?
We are now at the most crucial juncture in the potential Wyckoff accumulation pattern. The next phase will likely determine whether this is indeed accumulation or if we’re seeing a different market structure entirely.
The Spring: A Bullish Trap for Sellers
In a textbook Wyckoff accumulation, we should expect to see a Spring. This is a deliberate move below the Selling Climax low (in this case, below $60,000) designed to trap late sellers and shake out weak hands.
CRITICAL: The Spring should occur on LOWER volume than the Selling Climax.
A bullish Spring scenario would look like this:
1. Price drops below $60,000, potentially reaching $50,000-$52,000
2. Volume is noticeably lower than during the Selling Climax
3. Price quickly recovers back above $60,000 within a few days
4. Subsequent rally shows increasing volume (Sign of Strength)
This scenario would strongly confirm the accumulation pattern and likely lead to a significant upward move.
Bearish Breakdown: Wyckoff Accumulation Pattern Invalidation
Conversely, if we see the following, it would likely invalidate the accumulation thesis:
1. Price drops below $60,000 on HIGH or INCREASING volume
2. Sustained selling pressure with no quick recovery
3. Multiple daily closes below $60,000 with heavy selling volume
4. Failure to reclaim $60,000 quickly
This scenario would suggest distribution rather than accumulation and could lead to further downside.
Alternative Scenario: No Spring
It’s also possible that we don’t see a Spring at all. In some cases, accumulation can occur without breaking the Selling Climax low. In this scenario, we would look for:
1. Consolidation above $60,000
2. Decreasing volume during consolidation
3. A strong move upward breaking resistance around $72,000 on increasing volume
Specific Criteria to Watch
| Scenario | Price Action | Volume | Recovery |
|———-|————–|——–|———-|
| Bullish Spring | Below $60k | Lower than SC | Quick (1-3 days) |
| Bearish Breakdown | Below $60k | Higher than SC | Slow or none |
| No Spring | Above $60k | Decreasing | N/A |
Timeframe Expectations
If this is indeed a Wyckoff accumulation pattern, we could expect completion by early to mid-March 2026. However, markets can be unpredictable, and patience is crucial. Rushing to judgment before the pattern completes can lead to costly mistakes.
Confirmation Signals
For a bullish confirmation:
– Quick recovery after Spring
– Increasing volume on upward moves
– Higher lows forming on pullbacks
For bearish invalidation:
– Sustained trading below $60,000
– Increasing volume on downward moves
– Lower highs forming on rallies
Trading Implications & Risk Management
Trading a potential Wyckoff accumulation pattern requires careful risk management and position sizing. Here are some considerations:
Entry Strategies:
- Conservative: Wait for confirmation of the Spring and enter on the Sign of Strength
- Aggressive: Enter on the Spring low with a tight stop loss
- Scaled: Build a position gradually as confirmation signals appear
Stop Loss Placement:
- Below the Spring low (if confirmed)
- Below the Selling Climax low (more conservative)
- Use the Average True Range (ATR) to account for volatility
- Smaller size for aggressive entries
- Increase size as confirmation strengthens
- Never risk more than 1-2% of your trading capital on a single trade
Timeframe Considerations:
- This pattern typically plays out over weeks to months
- Be prepared for volatility and false moves
- Use multiple timeframes for confirmation (4H, Daily, Weekly)
Remember, no pattern is guaranteed. Always have a plan for both bullish and bearish scenarios.
Building Wyckoff accumulation pattern-Based Strategies with Arrow Algo
Traders can leverage Arrow Algo’s no-code platform to build and backtest Wyckoff-based trading strategies without writing a single line of code. Here’s how:
Identifying Key Phases:
- Use price action blocks to detect potential Selling Climax, Automatic Rally, and Secondary Test phases
- Implement volume comparison blocks to ensure proper volume relationships between phases
Spring Detection:
- Create a block that identifies price moves below support with volume filters
- Add conditions for quick price recovery
Confirmation Signals:
- Use momentum indicators to detect Signs of Strength
- Implement volume threshold blocks for validating increased buying pressure
Risk Management:
- Set dynamic stop-loss levels based on identified Wyckoff phases
- Create position sizing rules based on pattern completion percentage
Backtesting and Optimization:
- Use Arrow Algo’s backtesting engine to validate your Wyckoff strategy on historical data
- Optimize parameters like volume thresholds and timing of entries/exits
Alerts and Execution:
- Set up custom alerts for potential Springs or breakdowns
- Create execution blocks for automated trading based on your Wyckoff criteria
With Arrow Algo, you can visually construct complex Wyckoff-based strategies, test them rigorously, and deploy them in live markets – all without writing code.
Outlook & Conclusion
As of February 17, 2026, Bitcoin’s price action suggests we are at a critical juncture in a potential Wyckoff accumulation pattern. The next 2-4 weeks will be decisive in confirming or invalidating this thesis.
Key levels to monitor:
– $60,000: Critical support, potential Spring level
– $72,000: Resistance from Automatic Rally, potential Sign of Strength target
Remember, volume is the key to interpreting price action correctly. Low volume on downward moves and increasing volume on upward moves would support the accumulation thesis.
While the current market structure aligns with several aspects of a Wyckoff accumulation, it’s crucial to remain objective and consider alternative scenarios. This analysis provides one interpretation of the current market conditions, but it is not a guarantee of future price action.
Traders and investors should stay vigilant, manage risk carefully, and be prepared for multiple outcomes as this potential pattern unfolds.
Ready to build custom trading algorithms that respond to market patterns and price action? Visit https://www.arrowalgo.com to start creating your own strategies with Arrow Algo’s no-code platform.
Disclaimer: Algorithmic trading involves substantial risk. Past performance is not indicative of future results.
This content is for educational purposes only and should not be considered financial advice.
Always do your own research and consider consulting with a financial advisor before making trading decisions.