
Chaikin Oscillator Strategy: Trade the Zero-Line Cross
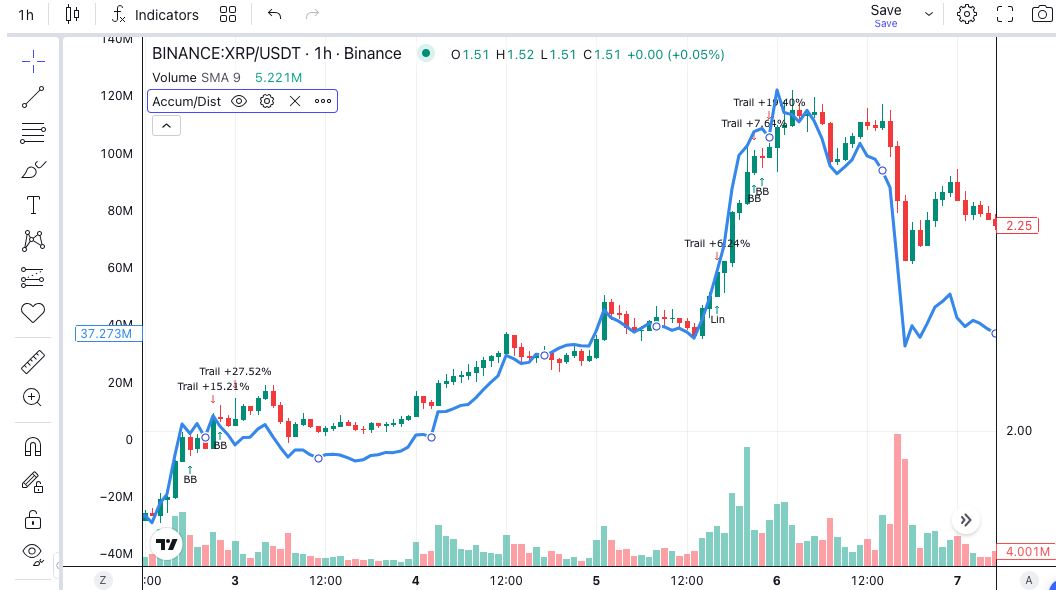
A Chaikin Oscillator strategy has an appealing promise: see buying pressure build before price makes the move obvious. The difficulty is frequency. With default settings, the oscillator crosses zero often, and every extra cross costs fees. This post builds a long-only research example that treats overtrading as the main problem to solve.
The settings below are hypotheses to test. They are not measured results or a recommendation.
What Does the Chaikin Oscillator Measure?
The Chaikin Oscillator measures the momentum of the Accumulation/Distribution Line. Marc Chaikin built it by subtracting a 10-period exponential moving average (EMA) of that line from a 3-period EMA. StockCharts documents the calculation.
The underlying line is a running total. Each candle adds or subtracts volume depending on where it closes within its own range. A close near the high on heavy volume adds a lot. A close near the low subtracts a lot. Our Accumulation/Distribution Line guide covers that part in detail.
So the oscillator answers a narrow question: is volume-weighted buying pressure speeding up or slowing down? Do not confuse it with Chaikin Money Flow. That indicator sums pressure over a fixed window. This one measures the change in pressure.
Why a Zero-Line Cross Differs From a Price Crossover
Above zero means the short average of the line is above the longer one. Recent accumulation is therefore running ahead of the slightly older trend. Below zero means the reverse.
Three properties shape the rules below:
- Price direction is not an input to the line. A candle can rise from the previous close, yet count as selling if it closes near its low.
- The cross is about pace. The oscillator can turn positive while the line itself is still declining. Selling has slowed, but buying may not have started.
- The scale changes with volume. A reading of 5,000 means little by itself. Zero is the only level that stays meaningful across markets.
That second point explains why a cross alone is weak evidence. It needs a separate view of the trend.
The Core Chaikin Oscillator Strategy: Rules to Test
Use four-hour candles and the default 3 and 10 settings for the first version. Change them only after the baseline is understood.
Entry Conditions
Generate a long entry signal only when all these hold on a completed candle:
- The oscillator was at or below zero on the previous candle and is above zero now.
- The close is above a 50-period EMA.
- At least six candles have passed since the last exit.
- The strategy is flat.
The first condition is the trigger. The second supplies the trend view that the oscillator lacks. The third is the cooldown, which stops the strategy buying straight back in after a whipsaw.
Model the fill at the next candle’s open, with fees and slippage included. A completed candle’s close is information, not a price you receive.
Variant A: Slower Settings
Change the settings to 6 and 20, and keep everything else. This should reduce the number of crosses. Check whether the extra delay gives back more than the lower trading costs save.
Variant B: Remove the Cooldown
Drop the six-candle wait. The difference between this version and the baseline shows what the cooldown is really worth. If there is little difference, remove it and keep the simpler strategy.
How Should the Position Exit?
Give the baseline two independent exits.
The signal exit fires when the oscillator crosses below zero on a completed candle. This is quick, and it may close good trades during a brief pause. Compare it with the time a typical winning trade stays open.
The protective exit sits two times the 14-period Average True Range (ATR) below entry. ATR measures typical candle movement. Capture that value when the trade opens and keep it fixed. Then size the position from your loss budget and the distance to the stop.
Record which exit closes each trade. If the signal exit closes nearly everything within a few candles, the oscillator is too fast for this market.
Where Do Chaikin Oscillator Backtests Go Wrong?
Ignoring turnover. This is the big one. A fast oscillator can produce a strong result before costs and a poor one after. Read the trade count first, then the fees paid as a share of gross profit.
Reading a cross as buying. A cross above zero can simply mean selling has slowed. The 50-period EMA filter exists for this reason. Test it, rather than assuming it helps.
Comparing raw values across markets. Bitcoin and a small altcoin produce completely different scales. Use the zero line, not fixed thresholds. Our volume analysis guide covers how to treat volume as evidence.
Check the Data and the Search
Volume from one venue. Exchange volume is venue-specific, so signals can differ between exchanges. Build and test on the venue you would actually use.
Thin or inflated pairs. The oscillator is only as honest as the volume feed. Unreliable volume produces unreliable crosses.
Forgetting the warm-up. The EMAs need time to settle. Exclude the first part of any test window.
Testing many settings, then keeping the best. Two periods give plenty of combinations. Log every variant, because the best of many looks better than it is. Our deflated Sharpe ratio post shows how large that effect can be.
Assembling the Chaikin Oscillator Strategy in Arrow Algo
The drag-and-drop visual builder expresses the baseline as a chain of visual blocks:
- Add the exchange’s candle data and select the four-hour timeframe.
- Connect high, low, close and volume to the Chaikin Oscillator block, then set the periods to 3 and 10.
- Feed the oscillator and a zero reference into a crossover block. Confirm the direction on a known historical candle.
- Add an EMA block on the close, and compare the close with it using a condition block.
- Use a counter block to track candles since the last exit, and compare the count with six.
- Combine these conditions and a flat-position check with an AND condition block.
- Connect the result to a buy action block. Under your rules, that block sends a signal.
- Build the oscillator exit and the ATR stop as separate branches into a sell action block.
Step through several signals candle by candle. Check one clean trend entry, one fast whipsaw, and one cross the EMA filter rejected.
Then run the variants on the same period and compare results after costs. No deployment is required for any of this. If you later choose to deploy, your rules signal your own exchange account and the exchange decides whether to execute.
Key Points to Carry Into Your Own Test
- The Chaikin Oscillator measures the pace of accumulation, not the level of it.
- A cross above zero can mean selling slowed, so pair it with a separate trend filter.
- Turnover is the main risk with the default 3 and 10 settings. Read results after costs.
- Use the zero line rather than fixed values, since the scale changes with volume.
- Exit on the cross back below zero, backed by an ATR stop fixed at entry.
Disclaimer: This content is for educational purposes only and does not constitute financial advice. Trading involves significant risk and you should only trade with capital you can afford to lose. Past performance is not indicative of future results. Always conduct your own research before making any trading decisions.
Ready to build your own automated trading strategies without writing a single line of code? Start for free at Arrow Algo and join thousands of traders who've made the switch to systematic trading.