
Detrended Price Oscillator Strategy: Time the Cycle
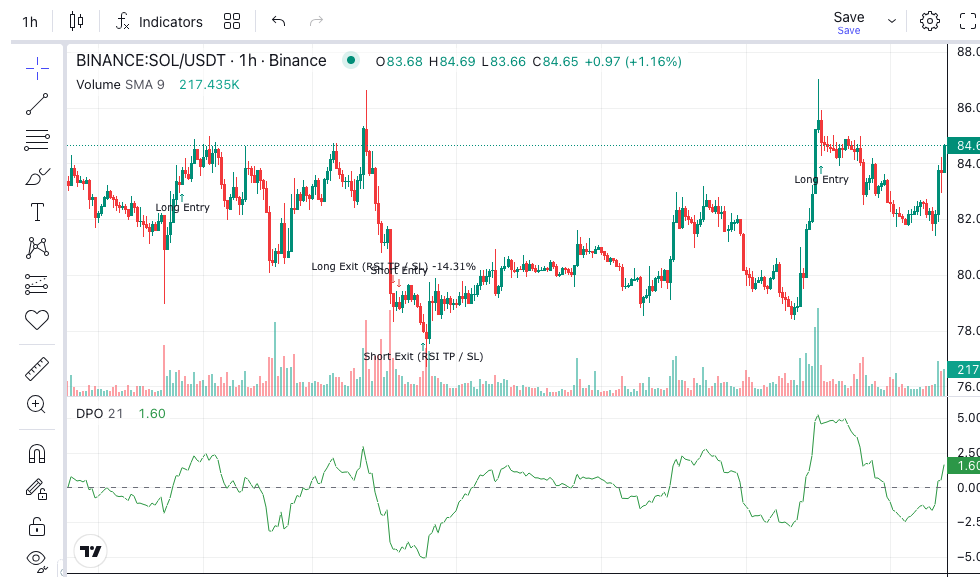
Most Detrended Price Oscillator strategy ideas fail for one simple reason. They treat a measurement of the past as a trigger for the present. The DPO is excellent at showing the rhythm of a market. It is poor at telling you what price is doing right now. This post builds a long-only research example that respects that difference.
The settings below are hypotheses to test. They are not measured results or a recommendation. For the indicator’s basics, start with our Detrended Price Oscillator guide.
What Does the DPO Actually Compare?
The DPO subtracts a moving average from an older closing price. With a 20-period setting, it takes the close from 11 candles ago and subtracts today’s 20-period simple moving average. StockCharts’ DPO reference documents the period ÷ 2 + 1 displacement.
That displacement is the clever part. It lines the old price up with roughly the middle of the average’s window. Slow trends mostly cancel out, which leaves the shorter swings on show.
The period acts as a filter. Swings much longer than the period get treated as trend and removed. Swings shorter than it remain visible.
Why the Latest DPO Reading Is Already Late
On a four-hour chart, 11 candles is 44 hours. A price low from Monday morning only appears as a DPO low around Wednesday morning. By then, price may have already moved a long way.
So a rule that buys when the DPO turns up from a trough is usually buying well after the low. This is not a flaw to fix. It is simply what the calculation does.
The practical conclusion is to split the jobs:
- The DPO provides context. It shows that a meaningful dip happened recently, and it helps you estimate cycle length.
- Current price provides the trigger. A short moving average reacts to the candle in front of you.
- A longer average provides direction. The DPO has removed the trend, so it cannot tell you the trend.
Our market cycles guide covers the longer rhythms this method deliberately ignores.
The Core Detrended Price Oscillator Strategy: Rules to Test
Use four-hour candles and a 20-period DPO for the first version. Before writing any rules, turn the raw reading into a comparable one. Divide the DPO by the 14-period Average True Range, which measures typical candle movement.
A raw DPO of minus 800 means little on its own. A scaled reading of minus 1.5 means the old price sat one and a half typical candles below the average. That reading stays comparable as the price level changes.
Entry Conditions
Generate a long entry signal only when all these hold on a completed candle:
- The scaled DPO reached minus 1.5 or lower at some point in the last 11 candles.
- The close crosses above a 10-period exponential moving average (EMA).
- The close is above a 100-period EMA.
- The strategy is flat.
The first condition says a real dip happened. The second says price has started recovering now. The third keeps the idea on the right side of the larger trend.
Model the fill at the next candle’s open, with fees and slippage included.
Variant A: The Naive Zero Cross
Replace the rules above with one trigger: buy when the DPO crosses above zero. This is the version many traders try first. Run it to measure how much the delay costs compared with the baseline.
Variant B: Remove the Trend Filter
Drop the 100-period EMA and keep everything else. Cycle dips in a falling market can look identical to dips in a rising one. This variant shows how much that matters on your chosen market.
How Should a Cycle Trade Exit?
Give the baseline two independent exits.
The time exit comes from the cycle itself. Measure the typical distance between DPO troughs on the earlier part of your data only. Then hold for about half that distance. If troughs sit about 30 candles apart, start with a 15-candle hold.
The protective exit sits two times the 14-period ATR below entry. Capture that value when the trade opens and keep it fixed. Investopedia’s ATR page explains the measure.
Record which exit closes each trade. If the stop closes most of them, the dip is often the start of a trend rather than part of a cycle.
Where Do DPO Backtests Go Wrong?
Reading a shifted chart. Some charting tools plot the DPO shifted back in time, so its turns line up neatly with price. That picture looks predictive, but those values were not available then. Check your block’s output against a known candle before trusting any visual pattern.
Assuming the cycle is fixed. Market cycles stretch and compress. Measure trough spacing across several separate periods. If it varies widely, the time exit has no stable basis. Our Hurst exponent post offers another way to ask whether a market is reverting at all.
Tuning the period to fit the chart. You can always find a period that makes past cycles look tidy. Each attempt is another trial on the same data. Our data snooping guide explains why that inflates results.
Check the Warm-Up and the Market Regime
Ignoring the warm-up. The 100-period EMA needs far more history than the DPO. Exclude the opening part of any test window.
Testing only one kind of market. Dip-and-recover logic tends to look best in calm uptrends. Include a sharp selloff and a long range in the test. Group the results by market regime rather than reading one blended figure.
Assembling the Detrended Price Oscillator Strategy in Arrow Algo
The drag-and-drop visual builder expresses the baseline as a chain of visual blocks:
- Add the exchange’s candle data and select the four-hour timeframe.
- Connect the close to a DPO block with a period of 20.
- Add an ATR block, then divide the DPO by it using a math block.
- Feed the scaled result into a minimum-in-period block over 11 candles, and compare the output with minus 1.5.
- Add two EMA blocks on the close, set to 10 and 100.
- Use a crossover block for the close against the 10-period EMA, and a condition block for the close against the 100-period EMA.
- Combine these conditions and a flat-position check with an AND condition block.
- Connect the result to a buy action block. Under your rules, that block sends a signal.
- Build the time exit and the ATR stop as separate branches into a sell action block.
Step through several signals candle by candle. Check one clean recovery, one entry that hit the stop, and one dip the trend filter rejected.
Then run the two variants against the baseline. No deployment is required for any of this. If you later choose to deploy, your rules signal your own exchange account and the exchange decides whether to execute.
Key Points to Carry Into Your Own Test
- The 20-period DPO compares a close from 11 candles ago with the current average. Its signals always arrive late.
- Use the DPO for context and cycle measurement, and current price for the trigger.
- Scale the DPO by ATR so readings stay comparable as the price level changes.
- Set the time exit from cycle length measured on earlier data, and back it with an ATR stop fixed at entry.
- Check that trough spacing stays reasonably stable across periods. If it does not, the cycle idea has no footing there.
Disclaimer: This content is for educational purposes only and does not constitute financial advice. Trading involves significant risk and you should only trade with capital you can afford to lose. Past performance is not indicative of future results. Always conduct your own research before making any trading decisions.
Ready to build your own automated trading strategies without writing a single line of code? Start for free at Arrow Algo and join thousands of traders who've made the switch to systematic trading.