
DI Crossover Strategy: How to Build It in Arrow Algo
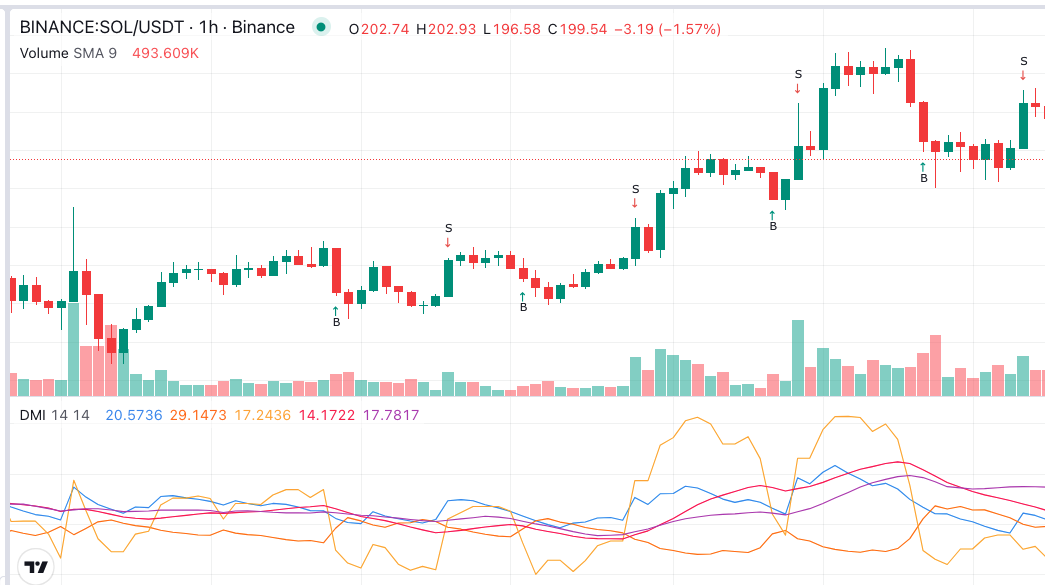
Most traders meet the DI crossover strategy as a footnote to ADX. The two directional lines cross, ADX confirms the trend is strong enough, and the trade goes on. That version is covered in our ADX DI strategy guide. This post takes the ADX away. It looks at what the DI+ and DI- lines can do on their own, why the raw cross is both faster and noisier than the filtered one, and which replacements for the ADX filter actually hold up in a backtest.
What Happens at a DI Crossover?
DI+ measures how much of recent price movement has been upward. DI- measures how much has been downward. Both are expressed as a share of the average true range, so they live on the same scale. When DI+ sits above DI-, buyers have been winning the range. When DI- sits above DI+, sellers have.
A DI crossover is the moment the ranking flips. DI+ crossing above DI- is a bullish cross. DI- crossing above DI+ is a bearish one. StockCharts describes the cross as the system’s directional trigger, with ADX as the strength gauge.
The cross says nothing about how strong the move is. It says only that the balance has tipped. That is the whole point of trading it alone. The signal arrives earlier than any strength filter can confirm it. The cost is that it also arrives in markets that are going nowhere.
Why Trade the Cross Without the ADX?
ADX lags. It is a smoothed average of a smoothed average, so it confirms a trend well after the DI lines have crossed. By the time ADX climbs above 25, a meaningful part of the move has already happened. Traders who wait for the confirmation enter later and exit later. In a short trend that lag can eat the entire profit.
Dropping the ADX gives you the raw cross. You enter earlier. You also enter in ranges, where the lines flip back and forth every few candles. The question is not whether to filter the cross. It is what to filter it with.
There are three candidates. The first is the spread between the lines after the cross. The second is a confirmation candle. The third is a different regime measure, such as a long moving average. Each is faster than ADX. Each is tested below.
Three DI Crossover Rule Sets
Treat each of these as a standalone strategy. Backtest them separately before combining anything.
Spread threshold after the cross
Go long when DI+ crosses above DI- and the gap between them exceeds a set value, such as 5 points. Exit when DI- crosses back above DI+. The spread requirement discards crosses where the lines are tangled together. Those are the ones that reverse the next candle.
Five points is a starting value, not a recommendation. On 4-hour Bitcoin candles a 14-period DI spread above 5 occurs on perhaps a third of crosses. Above 10 it is rare and usually marks a trend that is already well underway. Test the range between.
Cross plus a confirmation candle
Go long one candle after DI+ crosses above DI-, provided the lines have not re-crossed. Exit on the opposite cross. This is a time filter rather than a strength filter. A cross that survives one candle is far more likely to survive five.
The confirmation candle costs one bar of entry. In exchange it removes most of the single-candle whipsaws. On a 1-hour chart the trade-off is usually worth it. On a daily chart a full candle of lag may be too much.
DI cross as a trailing exit
Use a separate entry, such as a Donchian breakout or a moving average cross. Exit when DI- crosses above DI+. This turns the crossover into a dynamic stop that responds to the balance of buying and selling rather than to a fixed price distance.
The exit tends to fire before a deep pullback becomes a reversal. It also fires on shallow pullbacks that would have recovered. Pair it with a hard stop and compare the equity curve against a plain ATR trailing stop. On trending pairs the DI exit often holds longer. On choppy pairs the ATR stop usually wins.
Picking the Period and the Timeframe
The default period is 14, inherited from Wilder’s original work. Shorter periods make the lines cross more often and the spread swing wider. Longer periods smooth both. A 7-period DI on a 1-hour chart produces a signal nearly every session. A 28-period DI on a daily chart might cross a handful of times a year.
Match the period to the holding time you want. Then test the neighbourhood. If 12, 14 and 16 all produce a similar equity curve, the result is stable. If only 14 works, the backtest found a coincidence. Our guide to parameter optimisation covers how to read those tests.
Timeframe matters more than period. DI crosses on 15-minute candles are mostly noise on any period. On 4-hour and daily candles they begin to track real changes in control. Investopedia notes that the DMI family was built for daily data, and the lines behave best when the inputs are not dominated by intrabar noise.
Where the Crossover Lets You Down
Ranges. The lines cross constantly when price drifts sideways. Without a filter the strategy pays commission and slippage for a stream of tiny losses. The spread threshold helps. A moving average regime filter helps more.
Gaps and spikes. DI is built from true range. A single wide candle inflates both lines at once. The cross that follows is driven by that one bar, not by a change in control. Check whether the cross coincides with a volatility spike before trusting it.
Reading the spread as strength. A wide DI gap means one side has dominated the lookback window. It does not mean the trend will continue. The spread is a filter for the entry, not a forecast.
Mirroring the long rules for shorts. Crypto trends are not symmetrical. Downtrends are faster and spikier. A bearish cross rule tuned on the long side will often fire too late on the short side. Test them separately.
How to Build a DI Crossover Strategy in Arrow Algo
Choose one exchange, one pair and one timeframe. Work from completed candles so the cross does not repaint.
For the spread threshold version:
- Compute the lines. Add a DI block fed by high, low and close with a 14-period setting. It outputs DI+ on one slot and DI- on the other.
- Detect the cross. Feed both outputs into a Crossover block. Set it to fire when DI+ crosses above DI-.
- Measure the gap. Use a subtract block with DI+ and DI- as inputs. Compare the result against a fixed number block set to your threshold.
- Combine the conditions. Use a Condition block set to AND. Inputs: the cross fired, the spread is above the threshold, no open position.
- Wire the exit. A second Crossover block catches DI- crossing above DI+. Route it to the close order.
For the confirmation candle version, replace step 3 with a Latch block. The cross sets the latch. The entry fires only if the latch is still set on the next candle and DI+ remains above DI-.
For the trailing exit version, keep steps 1 and 5. Replace the entry with whichever signal you want to test. The bearish cross becomes the exit condition alongside your hard stop.
Attach a protective stop in every version. One ATR below the entry candle’s low is a sensible default. Then backtest, run a walk-forward test, and compare the three rule sets on the same pair and period.
What to Keep From This Guide
- A DI crossover is a change in the balance between buying and selling pressure. It is a directional trigger, not a strength reading.
- Trading the cross without ADX gets you in earlier and into more ranges. Replace the ADX filter rather than dropping it.
- Three testable rule sets: spread threshold, confirmation candle, DI cross as a trailing exit.
- The 14-period default is a starting point. Test the neighbourhood. Test 4-hour and daily candles before anything faster.
- Watch for crosses driven by a single wide candle. Test long and short rules separately.
Disclaimer: This content is for educational purposes only and does not constitute financial advice. Trading involves significant risk and you should only trade with capital you can afford to lose. Past performance is not indicative of future results. Always conduct your own research before making any trading decisions.
Ready to build your own automated trading strategies without writing a single line of code? Start for free at Arrow Algo and join thousands of traders who've made the switch to systematic trading.