
Walk-Forward Analysis: The Key to Adaptive Trading Strategies

Walk-forward analysis is a way of testing a trading strategy that mirrors how you would actually trade it: you optimize the strategy’s parameters on one window of historical data (in-sample), test those exact parameters on the next window the strategy has never seen (out-of-sample), then step both windows forward in time and repeat. Only the out-of-sample results count. That single rule is what makes walk-forward testing a far more honest check against overfitting than a standard backtest, which tests a strategy on the same data used to build it.
Market conditions shift, trends emerge and fade, and what worked yesterday may not work tomorrow. Walk-forward analysis bridges the gap between backtesting and live trading by showing how a strategy holds up as conditions change. In this post, you’ll learn:
- What walk-forward analysis is and why it matters
- How to run walk-forward optimization, step by step
- How to read walk-forward results, including the walk-forward efficiency ratio
- Best practices and common mistakes
- How to run walk-forward analysis in Arrow Algo without code
Understanding Walk-Forward Analysis
What is Walk-Forward Analysis?
Walk-forward analysis is a method of strategy development and testing that simulates trading in real time. Historical data is split into sequential windows, each with two parts:
- In-sample data: the portion used to optimize the strategy’s parameters.
- Out-of-sample data: the following portion, used only to test those parameters. The strategy had no part in shaping it, just as it will have no knowledge of future markets.
You optimize on the first in-sample window, record the result on its out-of-sample window, then “walk” both windows forward and repeat. The final performance figure combines only the out-of-sample results. Think of it like training for a marathon in segments: you practice each stretch, learn from it, and move on to the next, adapting as you go.
Why is Walk-Forward Analysis Important?
Traditional backtesting often leads to overfitting: you can always make a strategy look better by adjusting its parameters until they fit past data perfectly. Overfitted strategies perform brilliantly in backtests and fail in live trading. Walk-forward analysis helps mitigate this risk by:
- Simulating real-world conditions: It mimics the process of periodically re-optimizing your strategy as new data becomes available.
- Reducing curve-fitting: By testing on out-of-sample data, you get a more realistic view of strategy performance.
- Adapting to market changes: Regular re-optimization allows your strategy to evolve with changing market conditions.
- Providing more reliable performance metrics: Results from walk-forward analysis are generally more indicative of future performance than a single backtest.
It answers the question a standard backtest cannot: does this strategy generalize, or did it just memorize the past? It also gives you a record of how the strategy behaved across many different market phases, which makes it easier to stick with the strategy through a drawdown that falls within its tested range.
Implementing Walk-Forward Analysis
The Walk-Forward Process
Here’s a step-by-step breakdown of the walk-forward analysis process:
- Define your initial in-sample period: This is where you’ll first develop and optimize your strategy.
- Set your out-of-sample period: This is where you’ll test the optimized strategy.
- Optimize your strategy: Use the in-sample data to find the parameters with the best risk-adjusted results.
- Test on out-of-sample data: Apply the optimized parameters to the out-of-sample period without any further adjustment.
- Record results: Save the performance metrics from the out-of-sample test.
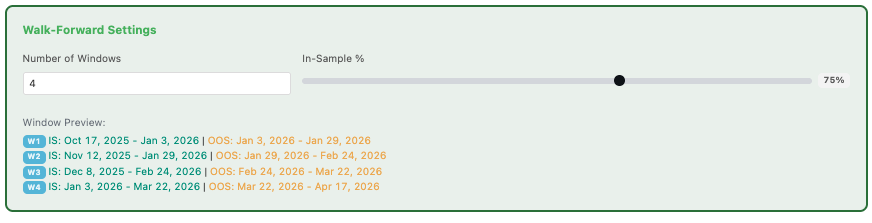
- Move forward: Shift your in-sample and out-of-sample windows forward in time, typically by the length of the out-of-sample period.
- Repeat and combine: Continue until you’ve covered all your historical data, then string the out-of-sample results together in chronological order. That combined equity curve is your walk-forward result.
Types of Walk-Forward Analysis
There are two main ways to move the in-sample window:
- Rolling Walk-Forward: Both the start and end dates of the in-sample period move forward, keeping a fixed window size. The strategy is always optimized on the most recent data, which helps it adapt to changing conditions.
- Anchored Walk-Forward: The in-sample start date stays fixed, and only the end date moves forward, so each optimization uses all data up to that point. This gives more data per optimization but adapts more slowly.
Each type has its advantages, and the best choice depends on your strategy and how quickly its market changes character.
How to Read Walk-Forward Results
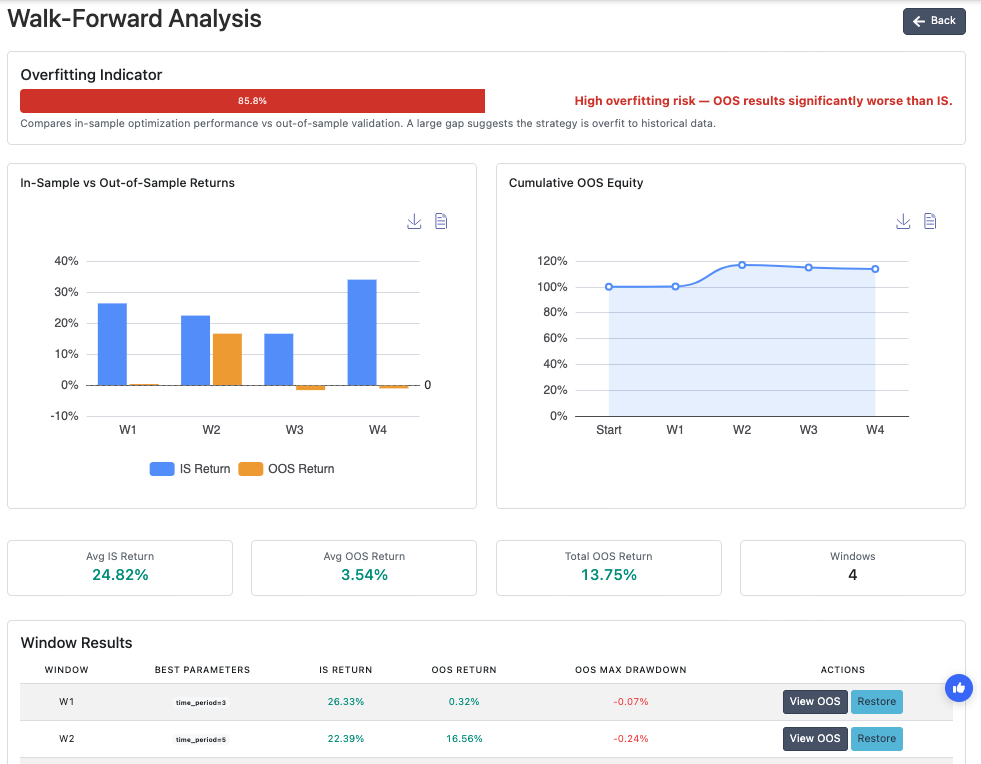
A strong walk-forward result shows consistent performance across multiple out-of-sample windows. No single window dominates. Drawdowns stay within acceptable bounds in most periods, and the combined equity curve trends upward even when individual windows underperform.
A weak result shows the opposite: performance concentrated in one or two windows, losses or flat results elsewhere, and a combined curve that hides deep inconsistency across market conditions.
One useful metric is the walk-forward efficiency ratio (WFE): out-of-sample performance divided by in-sample performance. A ratio above about 0.5 suggests the strategy generalizes reasonably well. A ratio close to zero or negative means the strategy is overfitted: its real-world performance is a fraction of what the in-sample results implied.
Best Practices for Walk-Forward Analysis
To get the most out of walk-forward analysis, consider these best practices:
- Choose appropriate window sizes: Your in-sample period should be long enough to capture market cycles, while your out-of-sample period should be long enough to provide meaningful results.
- Maintain a consistent ratio: Common splits run from 70:30 to 80:20 in-sample to out-of-sample, for example 70 days of optimization followed by 30 days of testing.
- Avoid over-optimization: Don’t try to squeeze every last bit of performance out of your in-sample data. A more robust strategy often performs better in the long run.
- Use realistic constraints: When optimizing, set parameter ranges that make sense for your strategy and market.
- Consider multiple metrics: Don’t focus solely on returns. Look at risk-adjusted metrics, drawdowns, and consistency of performance.
- Test across different market conditions: Ensure your walk-forward analysis covers both trending and ranging markets, as well as periods of high and low volatility.
Common Walk-Forward Analysis Mistakes to Avoid
- Using too small an out-of-sample window. A 5-day out-of-sample window contains too little data to draw meaningful conclusions. Use windows large enough to capture a variety of conditions, at least 20 to 30 trading days.
- Peeking at out-of-sample results. The point of walk-forward analysis is to optimize on in-sample data only. Using out-of-sample results to guide parameter choices turns them into in-sample data and defeats the purpose. This is a form of data snooping bias.
- Ignoring individual window results. Always examine each window separately, not just the combined result. Consistent performance across windows is far more meaningful than a strong combined figure driven by one exceptional period.
- Treating one successful walk-forward as final proof. A single test on one asset and one timeframe is a starting point, not a conclusion. Test across multiple assets and timeframes before committing a strategy to live trading.
Practical Applications in Algorithmic Trading
Let’s explore how walk-forward analysis can be applied to common algorithmic trading scenarios:
Adapting Moving Average Crossover Strategies
Imagine you’re using a simple moving average crossover strategy. With walk-forward analysis, you could:
- Optimize the lengths of your fast and slow moving averages on the in-sample data.
- Test the optimized parameters on the out-of-sample period.
- Re-optimize as you move forward, allowing your strategy to adapt to changing trends and volatility.
Evolving Momentum Strategies
For a momentum-based strategy, walk-forward analysis could help you:
- Optimize lookback periods and threshold levels for momentum indicators.
- Adjust position sizing based on recent market volatility.
- Adapt entry and exit rules as market dynamics change.
Refining Mean Reversion Strategies
In mean reversion trading, walk-forward analysis enables you to:
- Dynamically adjust overbought and oversold levels.
- Optimize the lookback period for calculating the mean.
- Adapt to changes in market volatility that affect mean reversion tendencies.
Running Walk-Forward Analysis in Arrow Algo
Arrow Algo includes walk-forward analysis as a built-in feature, so you don’t need external tools or spreadsheets:
- Build Your Strategy: Use the drag-and-drop block builder to set your entry rules, exit conditions and risk parameters.
- Set Up the Walk-Forward Test: Open the walk-forward analysis panel, define your in-sample and out-of-sample window lengths, and select the parameter ranges to optimize.
- Run the Analysis: Arrow Algo steps through each window, optimizes on the in-sample data, tests on the out-of-sample data, and combines the results into a single walk-forward equity curve.
- Analyze Results: The results panel shows performance by window alongside the combined out-of-sample curve, so you can judge both consistency and overall robustness.
- Refine and Iterate: Modify your strategy and re-run the analysis, taking care not to tune it to the out-of-sample windows.
Because Arrow Algo uses historical data directly from exchanges like Binance, Coinbase and HyperLiquid, the walk-forward test runs on the same data your strategy would have traded on, not a preprocessed third-party dataset. When you’re satisfied with the results, you can run the strategy live: Arrow Algo sends its signals to your connected exchange account, and your exchange executes the orders.
Conclusion: Embracing Adaptive Strategies
Walk-forward analysis is one of the most useful tools in the algorithmic trader’s arsenal. It tests your strategy on data it never influenced and shows whether it holds up as conditions change. By using it, you can:
- Reduce the risk of overfitting
- Create more robust, adaptive strategies
- Gain more reliable performance metrics
- Continuously evolve your trading approach
Remember, successful algorithmic trading is not about finding a single, perfect strategy. It’s about creating systems that hold up across changing markets. Ready to build and test your own strategies? Visit https://www.arrowalgo.com to start creating custom algorithms with Arrow Algo.
Did you enjoy this? You may like:
The Science of Trading Strategy Optimization
Backtest vs Live Results: How to Measure the Gap
Disclaimer: Algorithmic trading involves substantial risk. Past performance is not indicative of future results. This content is for educational purposes only and should not be considered financial advice. Always do your own research and consider consulting with a financial advisor before making trading decisions.
Educational disclaimer: This content is for educational purposes only and does not constitute financial advice. Trading involves significant risk and you should only trade with capital you can afford to lose. Past performance is not indicative of future results.