
Fibonacci Retracement Strategy: How to Build It in Arrow Algo
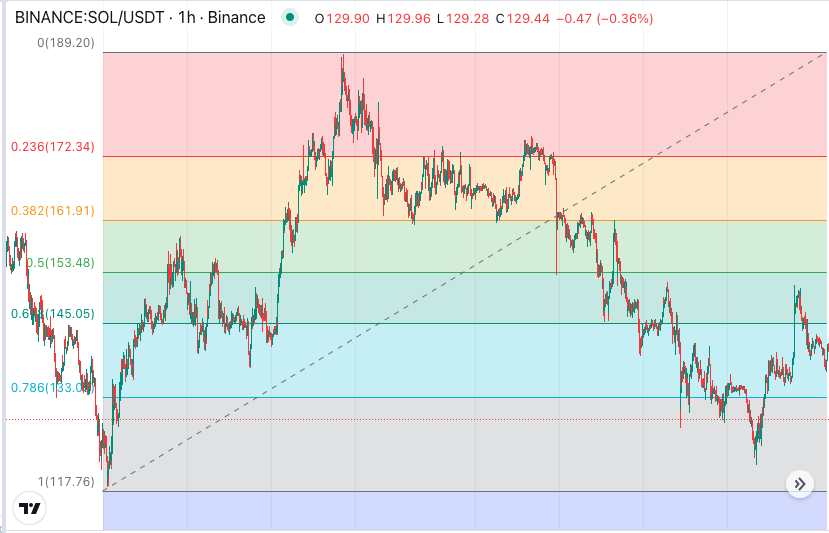
A Fibonacci retracement strategy buys pullbacks at mathematically defined levels — 38.2%, 50% and 61.8% of the prior move — instead of guessing where a dip might end. In a week where Bitcoin ran 20% almost without pausing, it is worth remembering that every trend eventually retraces. The question a systematic trader asks is: retraces to where?
What Is a Fibonacci Retracement Strategy?
A Fibonacci retracement strategy is a pullback-trading method. You measure a completed price swing — from a significant low to a significant high — and divide it at fixed ratios. Those ratios mark the zones where a healthy trend is most likely to pause and resume.
The standard levels are 23.6%, 38.2%, 50%, 61.8% and 78.6%. A shallow retracement to 38.2% signals a strong trend. A deep one to 61.8% is the classic “last defence” of the move. Beyond 78.6%, the odds shift towards full reversal rather than continuation. For the mathematical background, our Fibonacci retracement complete guide covers each level in depth.
Where Do the Retracement Levels Come From?
The ratios derive from the Fibonacci sequence, where each number is the sum of the two before it. Divide any number in the sequence by the next one and you approach 0.618 — the inverse of the golden ratio. The 38.2% level comes from skipping one number ahead; 23.6% from skipping two.
Do markets respect these levels because of deep mathematics? Probably not. They work largely because enough traders watch them, place orders around them, and turn them into self-fulfilling zones of supply and demand, as Investopedia notes. For a systematic trader that distinction barely matters — a level that attracts orders is tradeable either way.
How Do You Trade Fibonacci Retracement Levels?
Three readings drive most decisions:
- Depth of pullback. Holding 38.2% = strong trend, buy aggressively on confirmation. Reaching 61.8% = normal correction, buy with tighter risk. Breaking 78.6% = treat the trend as suspect.
- Reaction at the level. A level is a zone of interest, not a buy button. Wait for price to hold it — a bounce candle, a higher low, a momentum turn — before entering.
- Confluence. A Fibonacci level that lines up with prior support, a round number or a moving average is far more reliable than one floating alone.
What Are the Strongest Fibonacci Retracement Strategy Setups?
1. The Golden Pocket Entry
Enter long when price pulls back to the 61.8% zone of a completed upswing and prints a reversal signal there. Stop goes below the 78.6% level — if that breaks, the premise is dead. Target the prior high or beyond. Risk is small and defined; the reward is rejoining the whole trend.
2. The Shallow Pullback Continuation
In strong trends, price rarely gives you 61.8%. Buy the first hold of the 38.2% level after a momentum leg. This suits breakout follow-through — the pattern traders are eyeing after this week’s range escape, covered in our breakout trading guide.
3. The Confluence Stack
Only trade Fibonacci levels that coincide with independent evidence: old resistance turned support, a rising long-term moving average, or a high-volume zone. Fewer signals, materially higher quality.
Where Do Fibonacci Traders Go Wrong?
- Anchoring to the wrong swing. Draw from meaningful swing points, not every minor wiggle. Different anchors give completely different levels.
- Buying the level blind. Price slices straight through Fibonacci levels in weak trends. Demand confirmation at the zone.
- Treating levels as lines. They are zones. Give them a margin, especially on volatile crypto pairs.
- Using Fibonacci alone. Retracements say where a pullback may end — never whether the trend deserves rejoining. Pair them with a trend filter.
Building a Fibonacci Retracement Strategy in Arrow Algo
Arrow Algo’s no-code visual builder includes a Fibonacci block that computes retracement levels automatically from recent swing highs and lows:
- Drag the Fibonacci block onto the canvas and connect your price feed — it identifies the swing and outputs each retracement level live.
- Add a condition that fires when price enters your chosen zone, such as the 61.8% level.
- Stack a confirmation condition — for example, a momentum turn or a trend filter agreeing with the direction.
- Connect the combined logic to your buy order, with a stop placed beyond the next level down.
- Backtest on live exchange data from Binance, Coinbase or HyperLiquid to see which levels your pair actually respects.
That last step is the honest one: different assets respect different levels. Test before you trust.
What Are the Key Takeaways?
- A Fibonacci retracement strategy trades pullbacks to fixed ratios of the prior swing — 38.2%, 50% and 61.8% being the core zones.
- Depth of retracement is information: shallow pullbacks signal strength, deep ones demand tighter risk.
- Levels are zones needing confirmation and confluence, not automatic buy signals.
- Anchor your swings sensibly — wrong anchors produce worthless levels.
- Arrow Algo’s Fibonacci block computes levels live, so you can build and backtest the whole system without code.
Disclaimer: This content is for educational purposes only and does not constitute financial advice. Trading involves significant risk and you should only trade with capital you can afford to lose. Past performance is not indicative of future results. Always conduct your own research before making any trading decisions.
Ready to build your own automated trading strategies without writing a single line of code? Start for free at Arrow Algo and join thousands of traders who’ve made the switch to systematic trading.