
Ichimoku Cloud Strategy: How to Build It in Arrow Algo
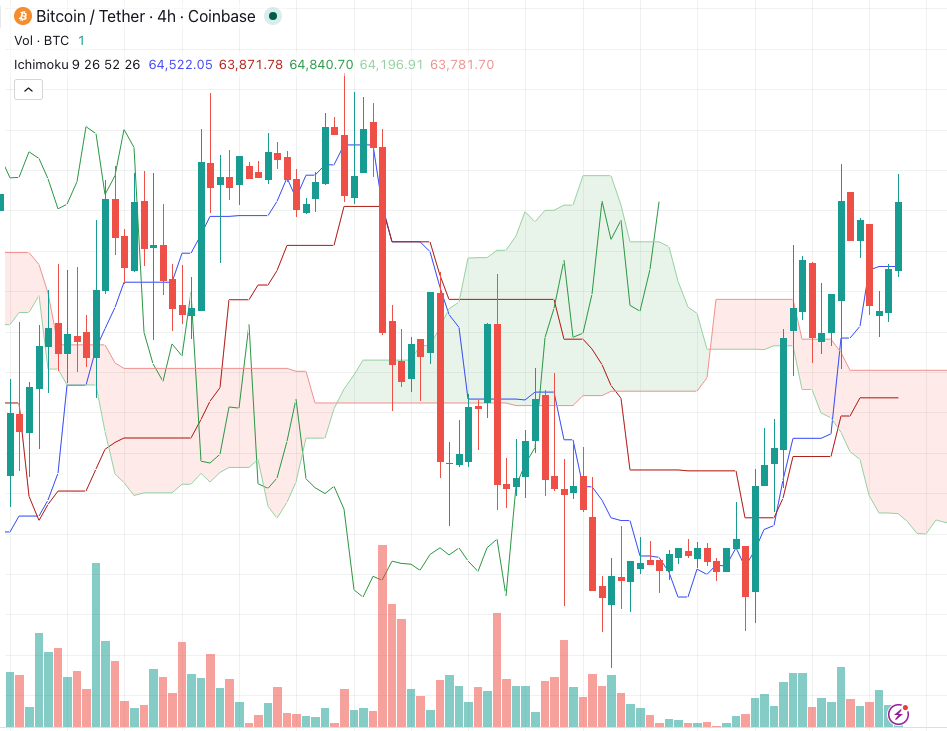
An Ichimoku Cloud strategy uses the cloud — the shaded area at the heart of the Ichimoku Kinko Hyo system — to define trend, filter entries and time exits in one visual package. Most traders see five overlapping lines and give up. That is a mistake. Reduced to rules, the cloud becomes one of the cleanest trend frameworks you can automate.
What Is an Ichimoku Cloud Strategy?
An Ichimoku Cloud strategy is a trend-following approach built on where price sits relative to the cloud (the Kumo). Price above the cloud signals an uptrend. Below it signals a downtrend. Price inside it signals indecision — a zone where disciplined systems simply stand aside. The cloud is projected 26 periods into the future. That forward shift is unique among mainstream indicators. It gives you a visual map of support and resistance ahead of price, not just behind it. If you want the full component-by-component breakdown, our Ichimoku Cloud complete guide covers every line in detail.
How Does the Cloud Actually Form?
Two lines create the cloud. Senkou Span A is the average of the Tenkan-sen (9-period midpoint) and Kijun-sen (26-period midpoint), plotted 26 periods ahead. Senkou Span B is the midpoint of the last 52 periods, also plotted 26 periods ahead. The space between them is the Kumo. When Span A sits above Span B, the cloud is bullish. When Span B is on top, it is bearish. The thickness matters too. A thick cloud represents strong historical support or resistance. A thin cloud is easier for price to slice through, per Investopedia’s overview of the system.
Which Ichimoku Cloud Signals Should You Trade?
Three cloud-based signals carry the most weight for systematic traders:
- Kumo breakout. Price closes above the cloud after trading below or inside it. This is the classic trend-change signal — late, but reliable in strongly trending markets.
- Cloud twist. Span A crosses Span B in the projected cloud. The twist flags a potential regime change before price confirms it.
- Cloud-edge bounce. In an established uptrend, price pulls back to the top of the cloud and holds. The cloud acts as dynamic support, offering trend-continuation entries.
The Tenkan/Kijun cross is a separate signal family — we will cover TK cross systems in their own dedicated post.
What Are the Best Ichimoku Cloud Strategy Setups?
1. The Kumo Breakout
Enter long when price closes above the cloud and the cloud itself is bullish (Span A above Span B). Exit when price closes back inside the cloud. This double condition — position and colour — filters out many false breaks. It shines on daily and 4-hour crypto charts where trends run for weeks.
2. The Cloud Trend Filter
Use the cloud purely as a regime filter and let a faster signal handle timing. For example: only take momentum entries while price is above the cloud, and only take shorts while it is below. Pairing the filter with a strength gauge such as the ADX trend strength strategy cuts out the chop that ruins most trend systems.
3. The Cloud-Edge Pullback
Wait for an established uptrend, then buy when price touches the upper cloud boundary and closes back above it. Place the stop below the cloud’s far side. The cloud thickness defines your risk automatically — thick cloud, wider stop, smaller position.
Which Mistakes Undermine Ichimoku Traders?
- Trading inside the cloud. The Kumo is a no-trade zone. Signals generated inside it are noise.
- Ignoring cloud colour. A breakout above a bearish cloud fails far more often than one above a bullish cloud.
- Using default settings on every timeframe. The 9/26/52 defaults come from six-day trading weeks decades ago. Backtest alternatives on 24/7 crypto data before trusting them.
- Stacking Ichimoku with redundant indicators. The system already contains trend, momentum and support/resistance. Adding three more moving averages adds correlation, not confirmation.
How Do You Build an Ichimoku Cloud Strategy in Arrow Algo?
Arrow Algo’s no-code visual builder includes a dedicated Ichimoku block with every line exposed as an output. Building the Kumo breakout takes minutes:
- Drag the Ichimoku block onto the canvas and connect your price feed.
- Add a condition comparing the close against Senkou Span A and Span B — price must be above both.
- Add a second condition requiring Span A above Span B, so the cloud is bullish.
- Combine both conditions and connect them to a buy order block.
- Mirror the logic for exits: close back inside the cloud triggers the sell.
Then backtest the whole thing on live exchange data from Binance, Coinbase or HyperLiquid before risking anything. No formulas to code, no data to source — just drag, connect and test.
What Are the Key Takeaways?
- An Ichimoku Cloud strategy reduces five lines to one question: where is price relative to the cloud?
- The Kumo breakout, cloud twist and cloud-edge bounce are the core systematic signals.
- Cloud colour and thickness act as built-in filters and risk guides.
- Never trade inside the cloud, and always validate the default settings on crypto data.
- Arrow Algo’s visual builder lets you assemble and backtest the full strategy without writing code.
Disclaimer: This content is for educational purposes only and does not constitute financial advice. Trading involves significant risk and you should only trade with capital you can afford to lose. Past performance is not indicative of future results. Always conduct your own research before making any trading decisions. Ready to build your own automated trading strategies without writing a single line of code? Start for free at Arrow Algo and join thousands of traders who’ve made the switch to systematic trading.