
MACD + EMA Trend Confirmation Strategy: How to Build It in Arrow Algo
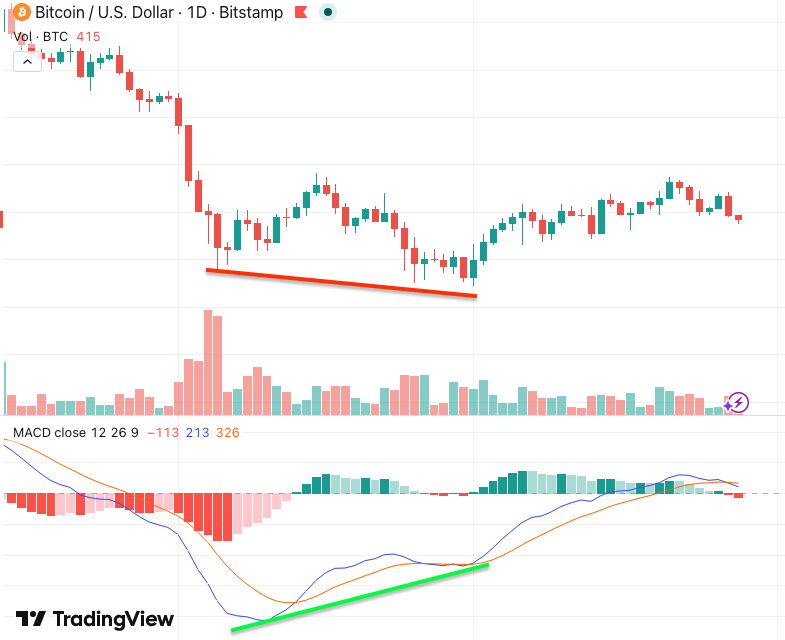
A MACD EMA strategy exists to fix the one thing MACD cannot do on its own: tell you which of its signals to ignore. MACD produces a crossover every time momentum flips. In a trending market roughly half of those crossovers point against the trend, and those are the ones that lose. Adding a long exponential moving average as a directional filter removes them before they reach your order book.
That sounds simple, and it is. It is also one of the most reliable improvements you can make to a crossover system. This guide covers what each component contributes, three rule sets that combine them, how to choose the EMA length, where the filter costs you, and the drag-and-drop build in Arrow Algo.
The Problem a MACD EMA Strategy Solves
Run a plain MACD crossover strategy on any trending pair and look at the trade list. You will find a pattern. The trades taken in the direction of the larger trend are mostly winners. The trades taken against it are mostly small losers that never got going.
MACD does not know which is which. It measures the gap between a 12-period and a 26-period EMA, then smooths that gap with a 9-period signal line. Every time the gap crosses its signal line, MACD fires. It has no concept of a larger trend because its longest input is 26 candles.
The fix is to give it one. A 200-period EMA summarises the trend over a horizon nearly eight times longer than anything MACD looks at. Price above it means the larger trend is up, and only long crossovers are allowed. Price below it means down, and only short crossovers are allowed.
This is the same principle behind every confluence approach. One indicator generates the signal. A second indicator with a different horizon decides whether the signal is worth taking.
What Each Component Adds
MACD supplies timing. The signal line crossover marks the moment short-term momentum turns. The histogram, which is the distance between the MACD line and its signal, shows whether that turn is gathering pace. Investopedia’s MACD reference covers the full calculation.
The EMA supplies direction. An exponential moving average weights recent candles more heavily than a simple average, so it turns sooner when the trend changes. At 200 periods it is still slow enough to ignore the noise MACD reacts to.
The two do not overlap. MACD is built from EMAs, but from short ones. Adding a long EMA is not stacking the same information twice. It is adding a horizon the indicator does not have.
Rule Sets for Trading MACD With an EMA Filter
Three ways to combine them, from simplest to most selective.
Rule Set 1: Directional Filter
The baseline version. Long entry requires two things on the same candle. The close is above the 200 EMA. The MACD line crosses above its signal line.
Short entry is the mirror. Close below the 200 EMA, MACD line crosses below the signal.
Exit on the opposite MACD crossover, or when price closes through the 200 EMA, whichever comes first. This version keeps the crossover system’s structure and simply deletes the counter-trend half of the trades.
Rule Set 2: Pullback to the EMA With a MACD Turn
The second version waits for a better price. In an uptrend, price pulls back toward the EMA. The entry needs the low of a recent candle to have come within a set distance of the 200 EMA, then a bullish MACD crossover as price turns back up.
This trades the trend at a discount instead of chasing it mid-move. The stop sits just below the EMA. If price closes through the average, the pullback has become a reversal and you are out.
Fewer signals fire. The ones that do have a defined invalidation point close to the entry.
Rule Set 3: Dual EMA Plus MACD Zero Line
The most selective version uses two EMAs and a second MACD condition. Long entry requires the 50 EMA above the 200 EMA, the close above both, and MACD crossing its signal while already above the zero line.
MACD above zero means the 12 EMA is above the 26 EMA, so short-term momentum agrees with the trend. A crossover that happens there is a continuation signal inside an established move. Crossovers below zero in an uptrend are often the first bounce off a deep pullback and fail more often.
This rule set misses the early part of new trends by design. It trades the middle, which is where trend systems make most of their money.
Choosing the EMA Length
There is nothing magic about 200. It is a convention that works well on daily charts because it covers most of a year of trading. On four-hour candles, 200 periods is just over a month. On one-hour candles it is eight days.
Shorter EMAs let more trades through and flip direction sooner. Longer EMAs hold the direction through pullbacks but give up more ground at true reversals. Backtest 100, 150 and 200 on the timeframe you intend to trade. If the results are similar, the filter is robust. If one length wins by a wide margin, be suspicious. That is often overfitting.
A useful second check is EMA slope. Price above a falling 200 EMA is a weaker signal than price above a rising one. Requiring the EMA to be higher than it was 10 candles ago removes trades taken in the last gasp of a dying trend.
Where the Filter Costs You
A MACD EMA strategy pays for its cleaner trade list in three ways.
Late entries. The EMA confirms a trend only after it has run for a while. You will never catch the bottom or the top. Accept that. Catching the middle is the goal.
Whipsaw around the EMA. When price oscillates across the average, the filter flips repeatedly and can produce a string of small losses. An ADX filter above 20 or a minimum distance from the EMA reduces this.
Missed reversals. A genuine trend change starts with a counter-trend MACD signal that the filter blocks. You catch it later when price crosses the EMA. That is the correct trade-off for a trend system, but it means this strategy is not a reversal tool.
None of these are reasons to drop the filter. They are reasons to backtest it honestly, with fees and slippage included, rather than assuming it can only help.
How to Build a MACD EMA Strategy in Arrow Algo
Everything below is drag-and-drop on the visual canvas. No code.
Drop a MACD block with the defaults of 12, 26 and 9. It outputs the MACD line, the signal line and the histogram as separate values.
Add an EMA block with the period set to 200.
For the direction condition, add a comparison block. Wire the candle close and the EMA output into it and set it to “greater than”.
For the timing condition, add a crossover block with the MACD line and the signal line as inputs. It fires on the candle where the MACD line crosses above the signal.
Join the comparison and the crossover with a condition block set to AND with two inputs. Both must be true on the same candle for the long entry to fire.
For rule set 3, add a second EMA block at 50 and a second comparison checking the 50 EMA against the 200. Add a third comparison checking the MACD line against zero. Chain the conditions with additional AND blocks.
For the exit, wire a second crossover block in the opposite direction. Add a comparison for close below the EMA and join the two exits with a condition block set to OR. Attach an ATR block to size the stop off current volatility.
Then backtest. Arrow Algo pulls historical candles straight from Binance, Coinbase and HyperLiquid, so you are testing on real exchange data. Run the filtered version against the plain EMA crossover and the unfiltered MACD version on the same pair and period. The difference in the trade list is the whole argument for this strategy.
What to Remember Before Testing
- MACD supplies timing. The long EMA supplies direction. Neither does the other’s job.
- Only take crossovers that agree with the side of the EMA price is on. This removes the counter-trend half of the trade list.
- Pullback entries near the EMA give a tighter stop than mid-move entries.
- Requiring MACD above zero for longs turns the crossover into a continuation signal.
- Test 100, 150 and 200 as EMA lengths. Robustness across all three matters more than the best single number.
- The filter costs late entries and missed reversals. That is the price of a cleaner trend system.
- Compare filtered and unfiltered versions on the same data before trusting either.
Disclaimer: This content is for educational purposes only and does not constitute financial advice. Trading involves significant risk and you should only trade with capital you can afford to lose. Past performance is not indicative of future results. Always conduct your own research before making any trading decisions.
Ready to build your own automated trading strategies without writing a single line of code? Start for free at Arrow Algo and join thousands of traders who've made the switch to systematic trading.