
Mass Index Reversal Bulge Strategy: Test the Signal
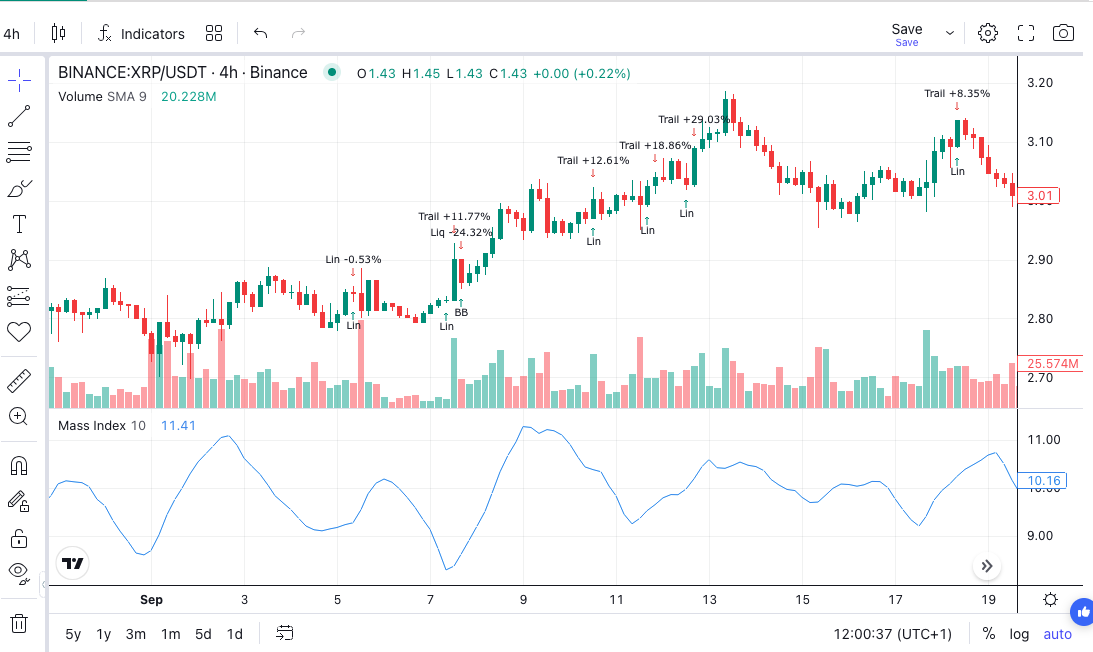
The Mass Index reversal bulge has a bold reputation: it warns that a trend is about to turn. We checked that claim on three years of crypto candles, and the warning did not point anywhere useful by itself. That does not make the signal useless. It tells you what job to give it in a strategy.
The rules below are hypotheses to test. They are not a recommendation, and the table is not a strategy backtest.
What Does the Mass Index Reversal Bulge Measure?
The Mass Index tracks the size of each candle’s range, not its direction. Donald Dorsey designed it to flag unusual range expansion. Our Mass Index guide covers the indicator in full, but the recipe is short:
- Take each candle’s high minus its low.
- Smooth that range with a 9-period exponential moving average (EMA).
- Smooth the result again with another 9-period EMA.
- Divide the first average by the second.
- Add up that ratio over 25 candles.
If the range never changed, every ratio would equal 1, and the index would sit at exactly 25. A reading of 27 means the ratio has averaged 1.08 across that window. Ranges have been expanding faster than their own smoothed trend.
The reversal bulge is a two-step pattern. The index rises above 27, then falls back below 26.5. The second step marks the moment expansion starts to fade.
Does the Reversal Bulge Actually Predict Reversals?
We measured this on Binance candle data from November 2023 to November 2026. We used four-hour candles and the standard 9 and 25 settings.
We called a bulge “right” if price later moved against the prior trend. We checked 30 candles later, or five days. If the close sat above its 50-period EMA at the signal, price had to be lower. If it sat below, price had to be higher. We then ran the same check on every candle as a baseline.
| Market, 4-hour | Bulges | Reversal share after a bulge | Reversal share, all candles | Median 5-day move after a bulge | Median 5-day move, all candles |
|---|---|---|---|---|---|
| BTC | 68 | 47.1% | 50.4% | 2.34% | 2.99% |
| ETH | 60 | 48.3% | 52.6% | 3.04% | 4.02% |
| SOL | 45 | 46.7% | 50.0% | 6.45% | 5.19% |
These figures describe price behaviour before fees and slippage. They are not trading results. Moves ignore direction, and past behaviour may not repeat.
Bulges did no better than the baseline on any of the three. The gaps are small enough to be noise, so this is not evidence of a reliable opposite signal either. Later moves were also not consistently larger: smaller on BTC and ETH, larger on SOL.
Bulges were also even-handed. Of the 68 BTC signals, 34 fired above the 50-period EMA and 34 below it. On daily candles, BTC produced only six bulges in three years, which is too few to judge.
The practical reading is simple. Treat the bulge as context, and let something else choose the direction.
Mass Index Reversal Bulge Rules to Test
Use four-hour candles with the Mass Index period set to 25. The baseline gives the bulge a limited job: it opens a window, and a moving average cross supplies the direction.
Entry Conditions
Generate a long entry signal only when all these hold on a completed candle:
- The highest Mass Index value in the last 20 candles is above 27.
- The current Mass Index value is below 26.5.
- The 9-period EMA crosses above the 21-period EMA.
- The strategy is flat.
The first two conditions together confirm that a bulge finished recently. Model the fill at the next candle’s open, with fees and slippage included.
Variant A: Crossover Control
Remove both Mass Index conditions, and keep the rest. This is the test that matters most. If the plain crossover does as well, the bulge is adding complexity rather than edge.
Variant B: Prior Downtrend Only
Add a condition that the close is below a 100-period EMA. This restricts entries to attempted reversals, which is the original idea behind the pattern. Expect fewer trades, so check that enough remain to judge.
Variant C: Bulge as an Exit
Use the plain crossover for entry, and close the position when a bulge completes. This tests the defensive idea: range expansion may be a reason to step aside, even if it cannot call the next direction.
How Should the Position Exit?
Give the baseline and Variants A and B two independent exits.
The signal exit fires when the 9-period EMA crosses below the 21-period EMA on a completed candle. The protective exit sits two times the 14-period Average True Range (ATR) below entry. ATR measures typical candle movement. Capture that value when the trade opens and keep it fixed.
Size the position from your loss budget and the distance to the stop. Bulges follow unusually wide candles, so a fixed position size can carry much more risk than you expect.
Where Do Mass Index Backtests Go Wrong?
Assuming the pattern is frequent. BTC produced about 23 four-hour bulges a year in our sample. Filters will cut that further. Our backtest sample size guide explains why a small count limits what you can conclude.
Skipping the control. A profitable bulge strategy proves little if the same crossover made the same money without it.
Tuning the thresholds. Moving 27 and 26.5 until the results improve is another form of curve fitting. Log every pair you try, then read our post on the deflated Sharpe ratio.
Check the Data and the Calculation
Letting one wick decide. The index reads high minus low, so one liquidation wick can inflate the range. Inspect the candles behind several bulges to see what caused them.
Forgetting the warm-up. Two smoothing stages and a 25-candle sum need time to settle. Exclude the first part of any test window.
Trusting the 20-candle window blindly. Compare the signals with the bulges you can see on a chart. Some may take longer than 20 candles to complete, so test a longer window as a separate variant.
Assembling the Mass Index Strategy in Arrow Algo
The drag-and-drop visual builder expresses the baseline as a chain of visual blocks:
- Add the exchange’s candle data and select the four-hour timeframe.
- Connect the high and low to a Mass Index block, and set the period to 25.
- Feed its output into a Maximum In Period block with a length of 20. Check that value is above 27 using a condition block.
- Add a second condition block that checks the Mass Index is below 26.5.
- Connect the close to two EMA blocks, set to 9 and 21, and feed both into a crossover block.
- Combine those three conditions and a flat-position check with an AND condition block.
- Connect the result to a buy action block. Under your rules, that block sends a signal.
- Build the reverse cross and the ATR stop as separate branches into a sell action block.
Step through several signals on the chart. Check one bulge that led to an entry and one that expired without a cross. Compare a few index values with your charting tool too, because software can differ.
Then delete the Mass Index branch to create the control. No deployment is required for any of this. If you later choose to deploy, your rules signal your own exchange account and the exchange decides whether to execute.
Key Points to Carry Into Your Own Test
- A Mass Index reversal bulge means the index rose above 27, then fell below 26.5.
- It measures range expansion and carries no information about direction.
- On BTC, ETH and SOL four-hour candles, bulges did not beat the baseline reversal rate.
- Use it as a window or an exit, and let another rule choose the direction.
- Always run a plain crossover control on the same data and costs.
Disclaimer: This content is for educational purposes only and does not constitute financial advice. Trading involves significant risk and you should only trade with capital you can afford to lose. Past performance is not indicative of future results. Always conduct your own research before making any trading decisions.
Ready to build your own automated trading strategies without writing a single line of code? Start for free at Arrow Algo and join thousands of traders who've made the switch to systematic trading.