
Rate of Change Trading Strategy: How to Build It in Arrow Algo
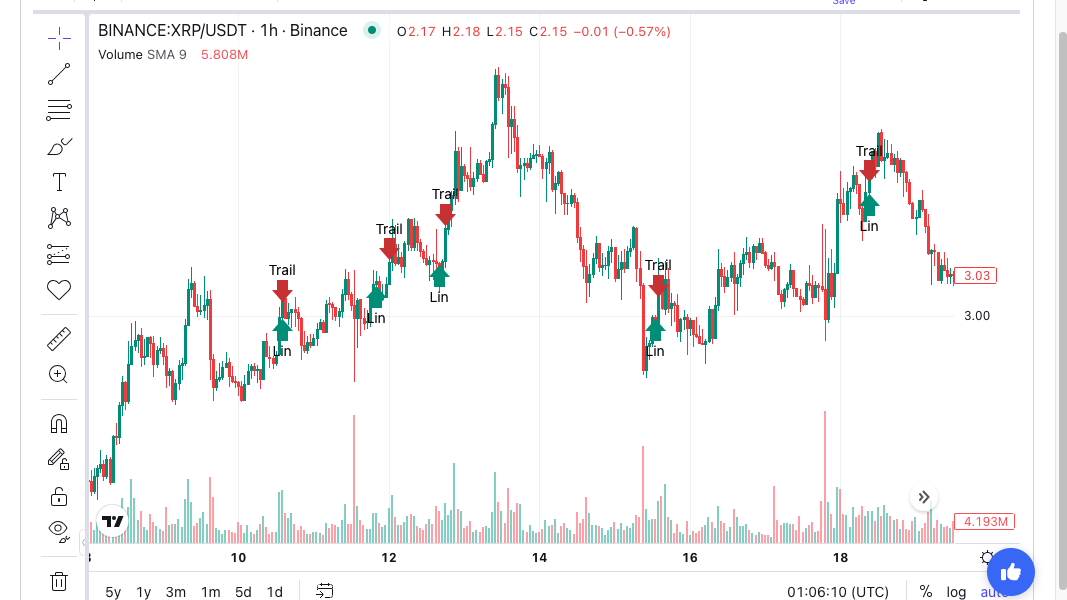
A rate of change trading strategy trades one simple measurement: how far price has moved over a fixed number of candles. No smoothing, no bands, no fitted lines. Just the percentage distance between now and n bars ago.
That simplicity cuts both ways. ROC responds quickly because nothing dampens it. It also whipsaws quickly for the same reason. The difference between a usable system and a noisy one comes down to the rules built around the raw reading.
This guide covers the measurement, three rule sets worth testing, and a no-code build in Arrow Algo’s visual block builder. Treat every setting here as a starting point for your own backtests, not a finished system.
How the Rate of Change Indicator Works
ROC compares the current close with the close n periods ago. It expresses the difference as a percentage of that older close. A 12-period ROC of +3 means price is 3% above where it stood 12 candles back. Tulip Indicators’ ROC reference documents the exact calculation.
The zero line is the natural dividing point. Positive readings mean price is higher than n bars ago. Negative readings mean it is lower. A cross of zero marks the moment recent momentum flips sign.
One quirk matters for testing. ROC has a fixed lookback, so a single large candle affects the reading twice. It moves ROC up when it enters the window. It moves ROC again when it drops out n bars later. That second move has nothing to do with current price action. Our ROC indicator guide covers the basic block in more depth.
Rate of Change Trading Strategy: Three Rule Sets
Zero-Line Cross with a Trend Filter
The simplest version buys when ROC crosses above zero and exits when it crosses back below. Unfiltered, this generates constant signals in sideways markets.
Add a regime condition. Require price above a long moving average, such as a 200-period EMA, before any long entry is allowed. The ROC cross then acts as the timing trigger inside an established uptrend, not a standalone signal. Investopedia’s ROC overview discusses why zero-line signals degrade without context.
Momentum Threshold Entry
A second version ignores small positive readings. It requires ROC to exceed a meaningful threshold — say +2% on a 12-period daily lookback — before entering. The hypothesis is different: strong recent movement continues more often than weak movement.
Thresholds do not transfer between assets or timeframes. A +2% reading is routine on a volatile crypto pair and rare on a slow one. Calibrate the level against each market’s own history before trusting it.
Exhaustion Fade
A third version trades against extremes. When ROC reaches a level that historically preceded stalls, it looks for reversion rather than continuation. This is the riskiest of the three. An extreme reading can simply become more extreme in a strong trend. If you test a fade, pair it with a hard invalidation and consider requiring a flat or counter-trend regime first.
Keep all three versions separate in testing. They express different hypotheses. Mixing their signals in one strategy makes the backtest impossible to interpret.
Building a Rate of Change Trading Strategy in Arrow Algo
Pick one exchange, one pair and one timeframe. Work from completed candles.
- Measure momentum. Feed closing prices into a ROC block with a 12-period setting.
- Define the regime. Add a 200-period EMA block on the same closes.
- Detect the trigger. Use a Crossover block to catch ROC crossing above a fixed zero value.
- Combine the conditions. Use a Condition block set to AND: crossover fired, close above the EMA, no open position.
- Wire the exit. A Crossover block in the opposite direction catches ROC falling back through zero.
For the threshold variation, swap the zero value for your calibrated level. The block layout stays identical — only the fixed number changes. That makes side-by-side testing straightforward.
Add a protective stop as well as the indicator exit. A stop below the entry candle’s low with an ATR allowance is one candidate. Record the stop at entry and do not let later volatility widen it.
A Worked Example with Numbers
Suppose a 12-period ROC on a 4-hour chart reads -1.5%, then a candle closes and the reading prints +0.4%. The zero cross has fired. Price closes at $100, above its 200-period EMA at $94. All entry conditions are satisfied.
The entry candle’s low is $98.20. With a half-ATR allowance of $0.80, the stop sits at $97.40 — $2.60 of risk per unit. A $52 risk allowance permits 20 units before fees and slippage.
Now the exit does its work. If ROC holds positive for thirty candles while price climbs to $108, the system captured the move. If ROC flips negative two candles later at $99.10, the system scratches the trade for a small loss. Both outcomes are the strategy working as designed. The backtest tells you whether the wins pay for the scratches.
Common Pitfalls When Testing ROC Systems
Counting the same signal twice. A crossover condition that stays true for several candles can fire repeated entries. Verify in the trade log that one cross produces one trade.
Ignoring the drop-off effect. ROC can flip sign because an old candle left the window, not because anything happened today. Inspect a sample of signals on the chart before trusting the aggregate numbers.
Tuning the threshold to the test data. Sweeping fifty threshold values and keeping the best one is curve-fitting. Compare a few sensible levels and check that neighbouring values behave similarly. Our parameter optimisation guide covers this in detail.
Testing one regime. A zero-line system tested only on 2026’s rebound will flatter itself. Include flat and falling periods before judging the edge.
Skipping costs. Frequent-signal systems live or die on fees and slippage. Model both, and funding too on perpetuals.
What Should You Take Away?
- ROC measures percentage change over a fixed window; the zero line marks the momentum flip.
- Zero-line, threshold and exhaustion versions are three different hypotheses — test them separately.
- A regime filter does most of the work of cutting sideways-market whipsaw.
- Calibrate thresholds per asset and timeframe; never copy them across markets.
- Verify signal timing, one-entry behaviour and the drop-off quirk in the trade log.
Arrow Algo’s drag-and-drop builder turns each version into a handful of connected blocks. The layout you can see is the strategy you are testing — nothing hidden, nothing assumed.
Disclaimer: This content is for educational purposes only and does not constitute financial advice. Trading involves significant risk and you should only trade with capital you can afford to lose. Past performance is not indicative of future results. Always conduct your own research before making any trading decisions.
Ready to build your own automated trading strategies without writing a single line of code? Start for free at Arrow Algo and join thousands of traders who’ve made the switch to systematic trading.