
RSI + Bollinger Bands Strategy: How to Build It in Arrow Algo
An RSI Bollinger Bands strategy is probably the most common two-indicator pairing in retail trading. It is also one of the most commonly built wrong. Traders stack the two indicators as if they were two votes on the same question. They are not. Each answers a different question, and the strategy only works when you let it.
Bollinger Bands tell you where price sits relative to its recent range. The Relative Strength Index tells you how fast it got there. A band touch says price is stretched. An RSI extreme says the stretch happened quickly. Put together, they describe a move that is both far from average and running out of speed. That is a much better reversal candidate than either signal alone.
This guide covers what each indicator contributes, three rule sets that use the pair properly, the exits that most combo strategies get wrong, and the drag-and-drop build in Arrow Algo.
Why Pair RSI With Bollinger Bands?
Both indicators have a known weakness, and the weaknesses are different.
Bollinger Bands measure distance from a moving average in standard deviations. In a strong trend, price can ride the upper band for a dozen candles. Every touch looks like an extreme and every fade loses. Traders call this “walking the band”.
RSI measures the speed of recent gains against recent losses. It also fails in trends, but in a slightly different way. A reading above 70 can persist for weeks in a genuine bull run. The indicator is not broken. It is describing sustained momentum.
Pairing them raises the bar. A price at the lower band with RSI at 45 is stretched but not fast. A price mid-band with RSI at 25 is fast but not stretched. Requiring both cuts the signal count sharply and removes the marginal cases. The confluence principle is doing the work here.
One caveat matters. Both indicators share the same worst case, which is a strong, persistent trend. Combining them reduces false signals inside ranges. It does not protect you when the market picks a direction and stays there. That job belongs to a regime filter, and we cover it below.
What Does Each Indicator Contribute?
The Bollinger Bands block outputs three lines. The middle line is a 20-period simple moving average. The upper and lower bands sit two standard deviations above and below it. Roughly 95% of closes land inside the bands when price is behaving normally.
A useful derived value is where the close sits between the bands. Zero means the lower band, one means the upper band, and 0.5 means the middle line. Anything above one or below zero is a close outside the bands. Thinking in these terms makes rules easier to write.
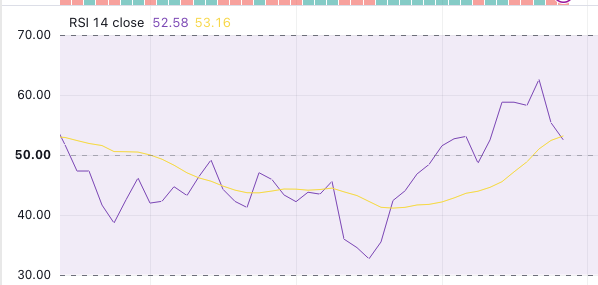
RSI runs on a 14-period default. The standard extremes are 70 and 30. For crypto, many systematic traders widen those to 75 and 25 because volatility pushes the indicator further. Backtest both. The threshold is a parameter, not a law. Investopedia’s RSI overview covers the calculation if you want the detail.
The RSI overbought and oversold post explains why raw threshold entries underperform. The short version is that “oversold” is a state, not an event. You need a trigger. The band provides one.
Entry Rules for an RSI Bollinger Bands Strategy
Three rule sets follow. Each uses the pair differently.
Rule Set 1: Classic Mean Reversion
This is the setup most people mean when they say RSI Bollinger Bands strategy.
Long entry needs two conditions. The candle closes below the lower band. RSI is below 30 on that same candle. Do not enter on the touch. Wait for the next candle to close back inside the band. That re-entry is the trigger. It confirms that sellers could not hold price outside the range.
Short entry is the mirror. Close above the upper band, RSI above 70, then a close back inside.
The target is the middle band. Not the opposite band. More on that in the exits section.
Rule Set 2: Band Touch With RSI Divergence
Here the band provides location and RSI provides evidence of exhaustion.
Price makes a new low that closes below the lower band. RSI makes a higher low than its previous reading at the last band touch. Price went further but momentum did not. That is bullish divergence, and it is a stronger signal than a raw extreme.
This setup fires less often and demands patience. When it does fire, the reversal tends to have more room. Stops go under the divergence low.
Rule Set 3: Trend Pullback to the Middle Band
The third setup flips the logic. It uses the pair to buy dips inside an uptrend rather than to fade extremes.
Regime first. Price is above a 50-period moving average and the bands are sloping upward. Entry needs a pullback to the middle band and an RSI reading between 40 and 50. Not below 30. In a healthy trend, RSI rarely reaches oversold on a pullback. A dip to the 40s with a bounce off the 20-period average is the tell.
This is a continuation trade. Target the upper band. Stop below the lower band.
Exits: Where Most Combo Strategies Leak Profit
Entries get all the attention. Exits decide whether the strategy is profitable.
The most common mistake is targeting the opposite band in a mean reversion trade. Price does not need to travel from one extreme to the other. It needs to return to average. The middle band is the statistically honest target, and it gets hit far more often. Aiming for the far band turns a high-probability trade into a coin flip.
Four exit tools work well in combination:
- Middle band cross. Close the trade when price closes across the 20-period average. This is the primary exit for rule sets 1 and 2.
- RSI back to 50. Momentum has normalised. If price has not reached the middle band by then, the reversion is weak and you should leave.
- Time stop. Mean reversion trades that have not worked within 8 to 10 candles usually will not. Exit and free the capital.
- ATR stop. Place the stop 1.5 ATR beyond the band the trade entered from. A fixed percentage ignores current volatility. ATR does not.
Backtest the exits separately from the entries. Keep the entry rules fixed and swap exits. You will learn more from that than from tuning thresholds.
When the Combination Fails
Three conditions break this strategy, and all three are detectable in advance.
Strong trends. Price walks the band and RSI stays extreme. Every fade loses. Fix: add an ADX filter and require a reading below 25 before any mean reversion entry. When ADX is above 25, switch to rule set 3 or stand aside.
Volatility squeezes. When the bands contract hard, a touch costs almost nothing. Price can close outside a tight band on ordinary noise. Fix: require Bollinger Band Width above a minimum level before accepting a signal. John Bollinger’s own reference site describes the squeeze in detail.
News candles. A single large candle on a macro print can close well outside the band with RSI pinned. The next candle often goes further. Fix: a confirmation close back inside the band, which rule set 1 already requires, plus a time filter around scheduled events.
Fees and slippage are the fourth failure, and they are self-inflicted. Mean reversion trades have small targets. Model realistic costs before you trust any backtest.
How to Build an RSI Bollinger Bands Strategy in Arrow Algo
Everything below is drag-and-drop on the visual canvas. No code involved.
Start with a Bollinger Bands block. Set the period to 20 and the deviation to 2. It outputs the upper, middle and lower lines as separate values.
Add an RSI block with the period at 14.
For the location condition, drop in a comparison block. Wire the candle close and the lower band into it and set it to “less than”.
For the speed condition, add a second comparison block. Wire RSI in and check it against 30.
Join the two with a condition block set to AND with two inputs. Both must be true on the same candle.
For the confirmation trigger, add a crossover block with the close and the lower band. It fires when the close crosses back above the band. Wire the AND output through a latch block so the setup is remembered until the crossover fires. That gives you “extreme first, re-entry second” without any code.
Add an ADX block and a third comparison requiring ADX below 25. Gate the whole entry behind it with another AND condition.
For exits, wire a second crossover block with the close and the middle band. Add an ATR block and use it to set the stop distance.
Then backtest. Arrow Algo pulls historical candles directly from Binance, Coinbase and HyperLiquid, so you are testing on the exchange’s own data. Run the three rule sets against each other on the same pair and period. Then run the winner through a walk-forward test before you consider going live.
Takeaways Before You Backtest
- Bollinger Bands measure distance from average. RSI measures speed. The pair works because the questions differ.
- Require both conditions on the same candle, then wait for a close back inside the band. The re-entry is the trigger.
- Target the middle band, not the opposite band. It is hit far more often.
- Both indicators fail in strong trends. An ADX filter below 25 is not optional for mean reversion entries.
- Filter out squeezes with a minimum band width. Cheap touches are not signals.
- Test exits separately from entries. Exits decide profitability.
- Model fees and slippage. Small targets are unforgiving.
Disclaimer: This content is for educational purposes only and does not constitute financial advice. Trading involves significant risk and you should only trade with capital you can afford to lose. Past performance is not indicative of future results. Always conduct your own research before making any trading decisions.
Ready to build your own automated trading strategies without writing a single line of code? Start for free at Arrow Algo and join thousands of traders who've made the switch to systematic trading.