
Williams %R Trading Strategy: How to Build It in Arrow Algo
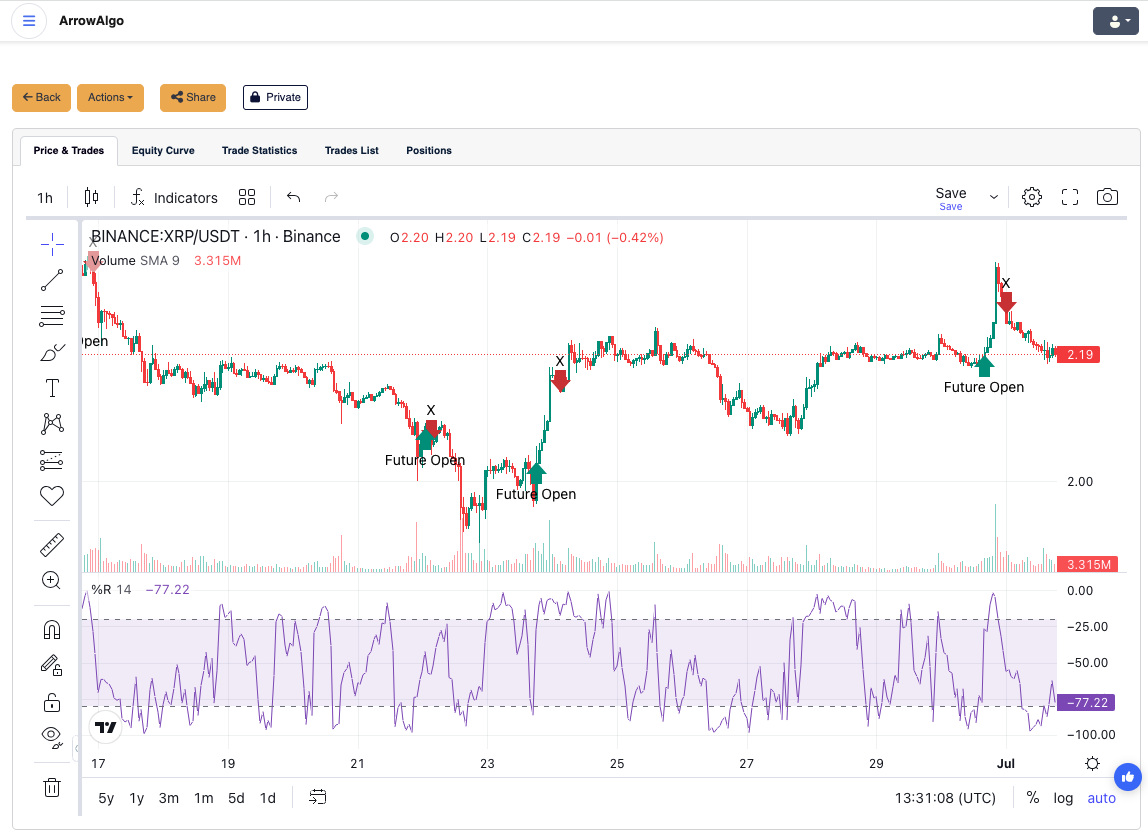
A Williams %R strategy trades momentum extremes using one of the fastest oscillators in technical analysis. Larry Williams built the indicator to answer a single question: where did price close relative to its recent high-low range? Close near the top of the range and %R reads near 0. Close near the bottom and it reads near -100. That speed makes it a favourite for timing entries — and a trap for anyone who trades it without a filter.
What Is a Williams %R Strategy?
A Williams %R strategy uses the indicator’s two extreme zones as its raw material. Readings above -20 mark overbought conditions: price is closing near the top of its recent range. Readings below -80 mark oversold: price is closing near the lows. The classic play is mean reversion — buy oversold recoveries, sell overbought failures. The sharper play adds a trend filter so you only fade extremes against the minor move, never against the major one.
If the logic sounds familiar, it should. %R is the Stochastic Oscillator flipped upside down, without the smoothing — which is exactly why it reacts faster and whipsaws more.
How Does the Calculation Work?
Over a lookback window — 14 periods is standard, per Investopedia — the indicator compares the current close to the highest high and lowest low. It expresses the result as a negative percentage from 0 to -100. In plain English: %R of -10 says “price closed in the top 10% of its recent range”. A reading of -90 says it closed in the bottom 10%. Nothing more. The power is in what closing position reveals about momentum: strong markets close near their highs, weak ones near their lows.
Reading the Zones
- Above -20: overbought — closes are pinned to the top of the range.
- Below -80: oversold — closes are pinned to the lows.
- The -50 midline: the momentum divide. Crossing it confirms a shift in control.
- Time spent pinned: in strong trends %R can sit above -20 for weeks. That is trend strength, not a sell signal.
Two Williams %R Strategies Worth Testing
The Oversold Recovery
- Filter: price above its 200-period EMA — you only buy dips inside uptrends.
- Setup: %R drops below -80.
- Entry: %R crosses back above -80 — the recovery has started, the knife has landed.
- Exit: %R reaching -20, or a fixed target; stop below the setup low.
The Midline Momentum Confirm
- Setup: the oversold recovery entry above.
- Confirmation: hold until %R also crosses -50, entering only then.
- Trade-off: later entries and smaller wins, but far fewer failed bounces — the same touch-versus-turn discipline as the RSI overbought/oversold strategy.
Building It in Arrow Algo
- Add a Williams %R block and connect your candle feed — the period is an editable property.
- Add an EMA block (200) with a condition block as the trend filter.
- Use a crossover block to detect %R crossing above the -80 level; add a second for the -50 confirmation variant.
- Route %R reaching -20 (or your fixed target) to the exit, with a stop below the recent low.
- Backtest both variants side by side on Binance, Coinbase, or HyperLiquid data. Measure whether the -50 confirmation earns its later entries in your market.
Where Does Williams %R Go Wrong?
- Fading strong trends. Overbought is not a sell signal in an uptrend — it is what uptrends look like. The trend filter is mandatory.
- Trading the touch, not the turn. Entering the moment %R hits -80 catches falling knives. The cross back out is the signal.
- Expecting smoothness. %R has no built-in smoothing, so it is noisier than Stochastic or RSI. Confirmation rules matter more here than with slower oscillators.
- Shortening the period. %R(5) marks extremes constantly; almost none of them mean anything.
The Essentials
- A Williams %R strategy trades range-position extremes: above -20 overbought, below -80 oversold.
- It is a faster, unsmoothed cousin of the Stochastic — quicker signals, more noise.
- Only fade extremes with the larger trend behind you, and enter on the cross back out of the zone.
- The -50 midline is a useful second confirmation for cutting failed bounces.
- Arrow Algo’s Williams %R block makes both variants drag-and-drop — the complete Williams %R guide covers the indicator’s full background.
Disclaimer: This content is for educational purposes only and does not constitute financial advice. Trading involves significant risk and you should only trade with capital you can afford to lose. Past performance is not indicative of future results. Always conduct your own research before making any trading decisions.
Ready to build your own automated trading strategies without writing a single line of code? Start for free at Arrow Algo and join thousands of traders who’ve made the switch to systematic trading.