
Backtest vs Live Results: How to Measure the Gap
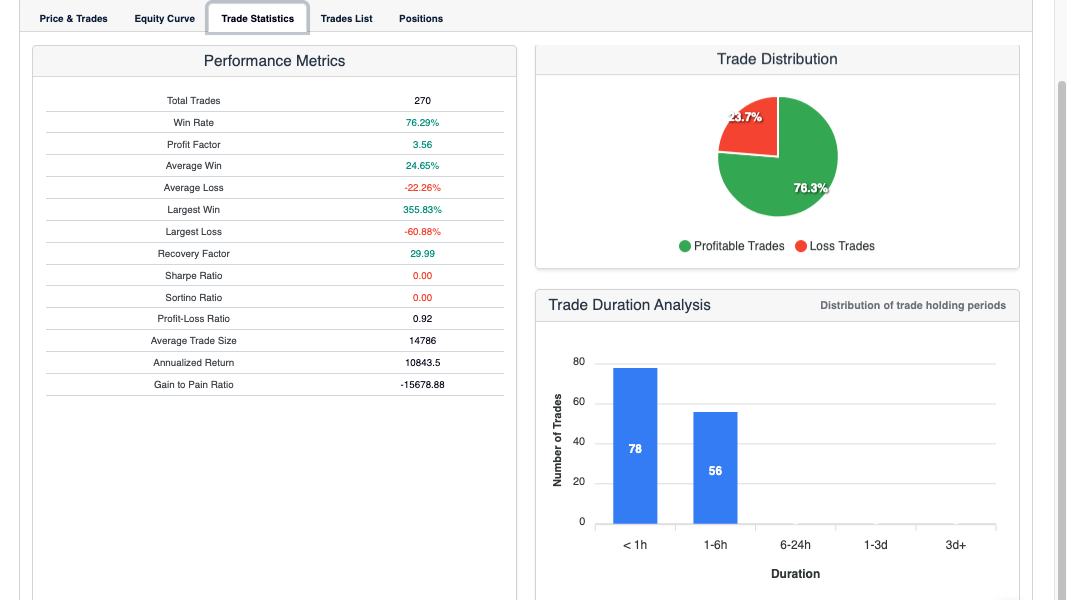
Comparing backtest vs live results is the first real test a strategy faces after it goes live. The equity curve in the report was smooth. The one in your account is not. Every algorithmic trader hits this moment, and most react in one of two bad ways. They panic and switch the bot off after a week. Or they shrug and let a broken strategy run for months. This post covers why the two curves diverge, how to put a number on the gap, and what size of gap should make you stop.
What Is Backtest vs Live Divergence?
Backtest vs live divergence is the difference between what a strategy earned in simulation and what the same rules earn with real money. It is measured over the same period, on the same pair, with the same settings. The divergence is the gap between the two.
Some gap is guaranteed. A backtest is a model of the market. It assumes fills at specific prices, fees at a specific rate, and data that matches what the exchange actually served. Live trading tests every one of those assumptions at once. The strategy that was correct on paper is now also being tested on execution, infrastructure and timing.
The useful question is not whether a gap exists. It is whether the gap is the size you expected. A strategy that backtested at 2% a month and earns 1.5% live is behaving. One that backtested at 2% and loses 1% live is telling you something.
Why Zero Gap Should Worry You
A live curve that tracks the backtest perfectly is a red flag, not a reassurance. It usually means one of two things. The live period is too short for any divergence to show. Or the strategy is trading so rarely that neither curve has moved.
Real execution costs are always positive. Every market order pays the spread. Every limit order sometimes misses a fill that the backtest assumed it got. Over enough trades, live always underperforms the idealised version by at least the cost of trading. If it does not, check that the backtest was charging fees and slippage at all.
The honest expectation is a small, steady drag. Researchers Bailey and López de Prado describe this in their work on backtest overfitting. Even a well-built strategy loses some edge the moment it leaves the sample it was tuned on. The question is how much.
Six Reasons Live Results Drift From the Backtest
Each of these has a different fingerprint. Learning to spot them separates a fixable problem from a dead strategy.
Fills and slippage
The backtest filled every order at the candle close. The exchange filled yours a few ticks worse. On a liquid pair that is a fraction of a percent per trade. On a thin altcoin it can be more than the average win. The fingerprint is a live win rate that matches the backtest while the average win shrinks.
Latency and candle timing
Your bot evaluates the rule when the candle closes. The order reaches the exchange a moment later. Price has already moved. The backtest did not model that moment. The fingerprint is entries that are consistently a little worse on fast-moving candles and fine on slow ones.
Fee tier
Backtests often use one flat fee. Exchanges charge by tier, and most retail accounts sit in the most expensive one. Binance publishes its fee schedule by volume level. A strategy that trades thirty times a month at the top tier pays a fee drag the backtest never saw. The fingerprint is a gap that scales exactly with trade count.
Data feed differences
The backtest ran on one data set. The live bot reads a different one. Candle timestamps can differ by exchange. Highs and lows can differ by a few ticks. An indicator that was computed on one series is now computed on another. The fingerprint is signals that fire a candle early or late compared with the backtest log.
Regime drift
The market the strategy was tuned on has changed. Volatility is lower. Correlations have shifted. The trend that fed a momentum rule has ended. The strategy is behaving exactly as designed in a market that no longer rewards that behaviour. The fingerprint is a gap that opens gradually and does not close. Our guide to a regime-switching strategy covers how to detect this inside the rules themselves.
Overfitting
The strategy was never real. The backtest found a pattern that existed in the sample and nowhere else. The live gap is immediate and total. Win rate collapses. Average win shrinks. Nothing resembles the report. This is the one that cannot be fixed by tuning, because there was nothing to tune.
How Do You Measure the Gap?
Guessing at the gap is how traders end up switching off good strategies and keeping bad ones. The fix is a side-by-side comparison on identical periods.
Start by running a fresh backtest over exactly the live period. Same pair, same settings, same start and end date. This gives you the strategy’s simulated result for the weeks it actually traded. Comparing against the original multi-year report tells you nothing. The live sample is a few weeks. The report is a few years. They will never match.
Then compare three numbers, not one. Total return is the obvious metric and the least useful. Compare win rate. Compare average win and average loss. Compare trade count. Each of the six causes above distorts a different number. A fee problem shrinks the average win. A data problem changes the trade count. Overfitting breaks all three.
Finally, track the gap over time rather than at one point. A gap that stays constant is a cost. A gap that widens is a decay. The two call for different responses. A cost can be modelled into the next backtest. A decay means the edge is leaving.
What Tolerance Is Acceptable Before Pausing?
There is no universal number. There is a method for finding yours.
Take the strategy’s backtest and apply a pessimistic set of costs. Double the slippage. Use your real fee tier. Delay every entry by one candle. This is the strategy’s realistic floor. If live results sit between the original backtest and this floor, the strategy is working. The gap is execution, and execution can be improved.
If live results fall below the pessimistic floor, pause. Not because the strategy is dead, but because something outside the cost model is going wrong. Check the data feed. Check the signal log against the backtest log. Look for regime drift. Resume only once the cause is found.
Sample size matters here. Our guide to backtest sample size explains why twenty trades tell you almost nothing. A strategy that averages three trades a week needs two months of live data before the gap means anything. Pausing after five losing trades is reacting to noise.
How to Apply This in Arrow Algo
Arrow Algo keeps the backtest and the live run on the same rules, which removes the most common source of divergence. The visual blocks you tested are the blocks that trade. There is no translation step where logic gets lost.
To measure the gap properly, run a backtest over the live period from the same strategy. Set the fee to your actual exchange tier rather than the default. Add slippage that matches what the order history shows for your real fills. Compare the trade list side by side with the live order history. Every trade the backtest took that the live run did not is a data or timing issue worth chasing.
Build the pessimistic floor as a second backtest. Clone the strategy, raise the costs, and keep that result as your pause threshold. When live performance crosses it, stop the scenario and investigate. A walk-forward test on the original strategy will show whether the edge held in recent windows or faded. Our guide to walk-forward analysis covers how to run one.
For the strategy itself, a short cooldown after any loss and a maximum trades-per-day rule both reduce the fee and slippage drag that drives most early-stage gaps. Both are a single Condition block in the visual builder.
What Are the Key Takeaways?
- Some gap between backtest and live results is guaranteed. Zero gap means too little data or no costs in the model.
- Six causes: fills, latency, fee tier, data feed, regime drift and overfitting. Each distorts a different metric.
- Measure against a backtest of the live period, not the original multi-year report.
- Compare win rate, average win and loss, and trade count. Total return alone hides the cause.
- Build a pessimistic-cost backtest as your pause threshold. Pause when live falls below it.
- Wait for enough trades before judging. A handful of losses is noise, not a verdict.
Disclaimer: This content is for educational purposes only and does not constitute financial advice. Trading involves significant risk and you should only trade with capital you can afford to lose. Past performance is not indicative of future results. Always conduct your own research before making any trading decisions.
Ready to build your own automated trading strategies without writing a single line of code? Start for free at Arrow Algo and join thousands of traders who've made the switch to systematic trading.