
Indicator Lag: Measure the Delay in Your Signals
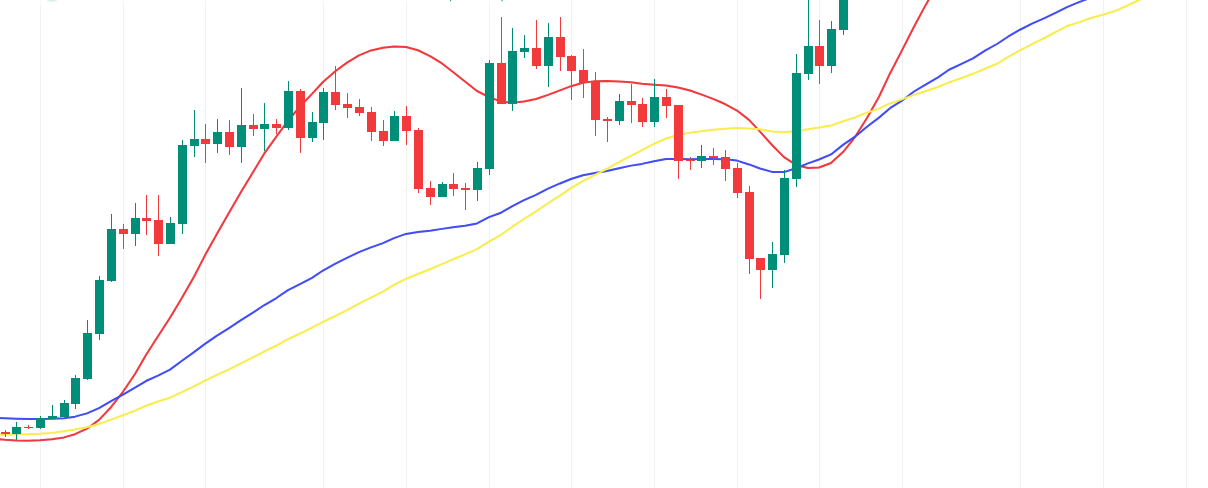
Indicator lag decides how much of a move has gone before your strategy notices it. Traders usually respond by looking for a faster indicator. That helps less than it sounds, because speed has a cost that rarely appears on the chart. This post puts numbers on the trade-off and shows how to measure it on your own trades.
What Is Indicator Lag?
Indicator lag is the delay between a change in price and the matching change in an indicator. It exists because most indicators average past data. Any average contains old candles, so it must trail the present.
You can state the delay in candles. A simple moving average of 20 periods has an average data age of 9.5 candles. The general formula is the period minus one, divided by two.
Timeframe converts that into real time. On four-hour candles, 9.5 candles is 38 hours. On daily candles, it is more than nine days.
In a steady trend, this shows up as distance. If price rises $100 per candle, a 20-period average sits about $950 below it.
Why the Delay Costs More Than It Appears To
A moving average crossover stacks these delays. A 10-period average lags by 4.5 candles and a 30-period average lags by 14.5. The pair needs price to change direction, and then the fast line must travel back through the slow one.
That matters most when moves are short. Suppose your typical winning trade lasts 12 candles. A signal arriving 8 candles late leaves little of the move to capture, and the exit is late too.
Lag also distorts how you read a chart. Your eye sees the turning point in hindsight. The strategy only sees it after enough new candles have changed the average.
Does a Faster Moving Average Solve the Problem?
Only partly. We calculated seven 20-period averages from their formulas, on artificial price series. The table is a property of the maths, not a backtest.
| Average | Delay on a steady trend | Sudden jump absorbed in 5 candles | Peak overshoot | Noise left, SMA = 1.00 |
|---|---|---|---|---|
| SMA | 9.5 candles | 25% | None | 1.00 |
| EMA | 9.5 candles | 39% | None | 1.00 |
| WMA | 6.3 candles | 43% | None | 1.14 |
| DEMA | 0 candles | 68% | 12% | 1.55 |
| TEMA | 0 candles | 89% | 18% | 1.95 |
| HMA | 0.7 candles | 87% | 26% | 2.03 |
| ZLEMA | 0.5 candles | 79% | 19% | 1.84 |
Three lessons stand out.
The EMA Is Not Simply Faster
An exponential moving average (EMA) and a simple moving average (SMA) of the same period have the same average delay. They also filter random noise equally well. The EMA reacts sooner to a jump because it weights new candles heavily. But it takes longer to finish. After 20 candles it has absorbed 87%, while the SMA has reached 100%.
Low-Lag Averages Trade Delay for Noise
Double, triple, Hull and zero-lag averages nearly remove the delay on a steady trend. They do it by extrapolating recent movement. That leaves roughly 1.5 to 2 times the noise in the line. More noise means more crossovers that lead nowhere.
Overshoot Is the Hidden Side Effect
After a sudden jump, these averages travel past the new price before returning. The Hull average overshot by 26% in this test. A price sitting still can therefore still produce a cross, purely from the indicator’s own correction. Smoothing filters always involve this kind of choice, and no setting removes it.
How Can You Measure Indicator Lag Yourself?
Formulas describe a clean trend. Markets are messier, so measure the delay on real candles with three simple checks.
Count candles at swing points. Pick 20 clear swing highs and lows. Count the candles from each price turn to the indicator’s turn. Use the median, because a few extreme swings will distort an average.
Compare entries directly. Run two versions of one strategy on the same data, changing only the average. Note how many candles earlier one version enters on the same moves. Then check whether it also made more entries that failed.
Delay the signal on purpose. Add one, two and three candles of delay to your entries. A real edge usually fades gradually. If one candle destroys the result, your backtest may depend on fills you would not get.
Choose Lag to Fit the Trade
Your lag budget should come from your holding period. Compare the median winning trade with the measured delay. A delay near half that holding time leaves little room for the exit, which lags as well.
Shortening the lookback period is the other lever, and it also adds noise. Treat every change as a new test, and judge it after fees. Our Zero-Lag EMA crossover strategy shows this comparison with a plain EMA control.
Beware the search itself. Trying many averages and keeping the best produces a flattering winner. Log every version you test, including the ones you discard.
How to Test Indicator Lag in Arrow Algo
The drag-and-drop visual builder makes these comparisons quick. Nothing requires code, and no deployment is needed.
- Build one strategy with visual blocks, using a plain EMA as the signal line.
- Clone it, and swap the EMA block for a Hull, DEMA or ZLEMA block with the same period.
- Backtest both on the same exchange data, with the same fees.
- Compare the trade count, median holding time and profit after costs.
- Insert a Lag block on the entry condition, then repeat with delays of one to three candles.
Keep every other setting fixed, so each difference traces back to the indicator. If you later choose to deploy, your rules signal your own exchange account and the exchange decides whether to execute.
The Short Version: Key Takeaways
- Indicator lag comes from averaging past data, and you can state it in candles.
- A simple or exponential average’s delay is the period minus one, divided by two.
- EMAs react sooner than SMAs to a jump, yet have the same average delay.
- Low-lag averages cut delay but carry up to twice the noise and can overshoot.
- Compare measured delay with your median holding time.
- Delay your signals deliberately to test how fragile the result is.
Disclaimer: This content is for educational purposes only and does not constitute financial advice. Trading involves significant risk and you should only trade with capital you can afford to lose. Past performance is not indicative of future results. Always conduct your own research before making any trading decisions.
Ready to build your own automated trading strategies without writing a single line of code? Start for free at Arrow Algo and join thousands of traders who've made the switch to systematic trading.