
Klinger Volume Oscillator Strategy: How to Build It in Arrow Algo
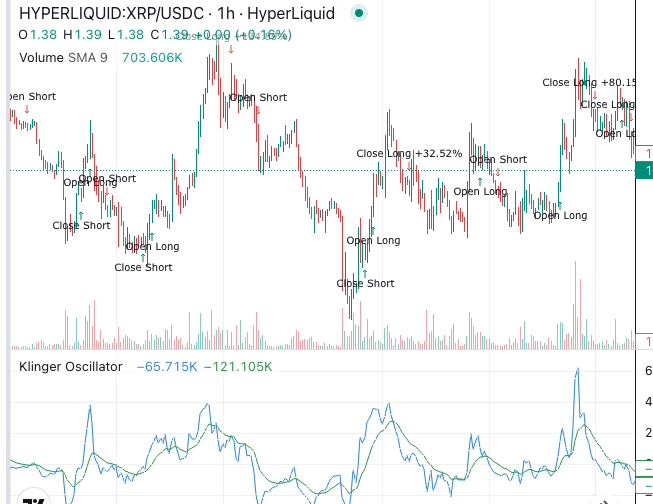
A Klinger Volume Oscillator strategy asks whether volume is moving in the same direction as price. Plenty of indicators cross a signal line. The KVO is one of the few where the crossing is driven by volume force rather than price alone. That makes it a candidate for a confirmation role, and this post builds a long-only research example around exactly that.
The settings below express a hypothesis. They are not measured results, and they are not a recommendation.
If you need the background first, read our Klinger Volume Oscillator guide. This post assumes you know what the indicator is and moves straight to rules.
What Is the Klinger Volume Oscillator Measuring?
The KVO measures the difference between two smoothed averages of a quantity called volume force. Volume force is each candle’s volume, weighted by how decisively price moved and in which direction.
A candle whose typical price rises counts as positive. One whose typical price falls counts as negative. A candle with a wide range and strong volume contributes more than a quiet one.
Two exponential moving averages, 34 and 55 periods by default, smooth that series. Investopedia’s Klinger Oscillator entry documents the standard settings. The oscillator is the fast average minus the slow one. A 13-period average of the oscillator is the signal line.
Do not confuse it with the plain Volume Oscillator, which compares two averages of raw volume with no direction at all.
So the KVO is not a price indicator with volume added on. It is a volume indicator that uses price only to decide the sign. That distinction shapes every rule below.
Why Volume Force Changes the Meaning of a Crossover
A moving average crossover on price says the recent average is above the older average. A KVO crossover says recent volume force is above its own recent average. Price can rise while volume force falls. That happens when a rally continues on shrinking volume.
The zero line adds a second layer. KVO above zero means the 34-period volume average exceeds the 55-period one. In plain terms, net buying volume over the past month and a half is stronger than over the past two and a half months.
A signal-line cross above zero therefore has two conditions behind it. Volume is accelerating, and it is accelerating from a position where buyers already dominate. A cross below zero is a volume bounce inside a seller-dominated regime. The research example treats those two situations differently.
Our volume analysis guide covers the broader logic of using volume as evidence rather than as a trigger.
The Core Klinger Volume Oscillator Strategy: Rules to Test
Use four-hour candles for the first version. The default 34, 55 and 13 settings are the starting point. Change them later, one at a time, if at all.
Entry Conditions
Generate a long entry signal only when all these hold on a completed candle:
- KVO was at or below its signal line on the previous candle and is above it now.
- KVO is above zero.
- The close is above a 50-period exponential moving average.
- The strategy is flat.
The first condition is the trigger. The second and third are filters. The last prevents stacking entries on a KVO that oscillates around its signal line.
Model the fill at the next candle’s open, with fees and slippage included. A completed candle’s close is information, not a price you receive.
Variant A: Drop the Price Filter
Remove the 50-period average and keep everything else. This tests whether the zero-line gate carries the trend information on its own.
If Variant A performs similarly, the price filter adds delay without value. If it performs worse, the KVO needs price alongside it. Either answer is useful.
Variant B: Bullish Divergence at a Swing Low
Keep the same filters but change the trigger. Enter when price makes a lower low over 20 candles while KVO makes a higher low over the same window, and then KVO crosses its signal line upward.
Divergence rules need careful definition. Specify the lookback and what counts as a low before testing. Our OBV divergence strategy post walks through the same definition problem with a simpler volume indicator.
How Should the Position Exit?
Give the baseline two independent exits. One tracks the signal. One limits the planned loss.
The signal exit fires when KVO crosses below its signal line on a completed candle. Do not wait for a zero-line cross. By the time volume force turns negative on the slow average, a long move has usually finished.
The protective exit sits at a fixed distance below entry. Use two times the 14-period Average True Range, captured at the moment of entry. ATR measures how far price typically moves per candle. Freezing it at entry stops a later volatility spike from widening the planned loss. Investopedia’s ATR page explains the measure.
Size the position from the loss budget and the entry-to-stop distance. Then record which exit closed each trade. If the protective stop closes most of them, the KVO exit is too slow for this market.
Where Do KVO Backtests Go Wrong?
Treating every cross as equal. A cross at plus 40,000 and a cross at minus 40,000 are different events. The zero-line filter exists for this reason. Test with and without it, and look at the two groups separately.
Comparing raw KVO values across markets. The oscillator’s scale depends on volume. A Bitcoin reading and a small-cap altcoin reading are not comparable. Use crosses and the zero line, not fixed levels.
Forgetting the warm-up period. The 55-period average needs 55 candles, and the signal line needs 13 more on top. Exclude the first part of any test window.
Check the Volume Data Itself
Volume from one venue. Exchange volume is venue-specific. The KVO on one exchange’s data can disagree with another’s. Build and test on the venue you would actually use.
Wash-traded or thin pairs. The indicator is only as honest as the volume feed. Pairs with inflated or sparse volume produce volume force readings that mean nothing.
Over-tuning three parameters at once. The 34, 55 and 13 settings give a wide search space. Change one, re-run, and keep a log. A best-of-fifty result is a selection effect, not an edge.
Assembling the Klinger Volume Oscillator Strategy in Arrow Algo
The drag-and-drop visual builder expresses the baseline as a chain of visual blocks:
- Add the exchange’s candle data and select the four-hour timeframe.
- Connect the candle feed to the KVO block. It needs high, low, close and volume, so make sure volume is wired in.
- Feed the oscillator and signal outputs into a crossover block. Confirm the crossing direction on a known historical candle.
- Compare the oscillator with a zero reference using a condition block.
- Add an EMA block on close and compare price with it.
- Combine the three conditions and a flat-position check with an AND condition block.
- Connect the result to a buy action block. Under your rules, that block sends a signal.
- Build the KVO exit and the ATR stop as separate branches into a sell action block.
Step through several entries candle by candle. Pick one clean trend entry, one entry in a chop, and one that the zero-line filter rejected. The rejected one tells you the most.
Then run the variants on separate test periods. No deployment is required for any of this. If you later choose to deploy, your rules signal your own exchange account and the exchange decides whether to execute.
Key Points to Carry Into Your Own Test
- The KVO measures volume force, with price only setting the sign. Read it as volume evidence, not as a price oscillator.
- A signal-line cross above zero and one below zero are different events. Test them separately.
- Use crosses and the zero line, never fixed KVO levels. The scale changes with volume.
- Exit on the signal-line cross down, backed by an ATR stop frozen at entry.
- Volume quality decides the indicator’s quality. Build on the venue and pair you would actually use.
Disclaimer: This content is for educational purposes only and does not constitute financial advice. Trading involves significant risk and you should only trade with capital you can afford to lose. Past performance is not indicative of future results. Always conduct your own research before making any trading decisions.
Ready to build your own automated trading strategies without writing a single line of code? Start for free at Arrow Algo and join thousands of traders who've made the switch to systematic trading.