
SuperTrend KO Strategy: Why the Settings Matter So Much
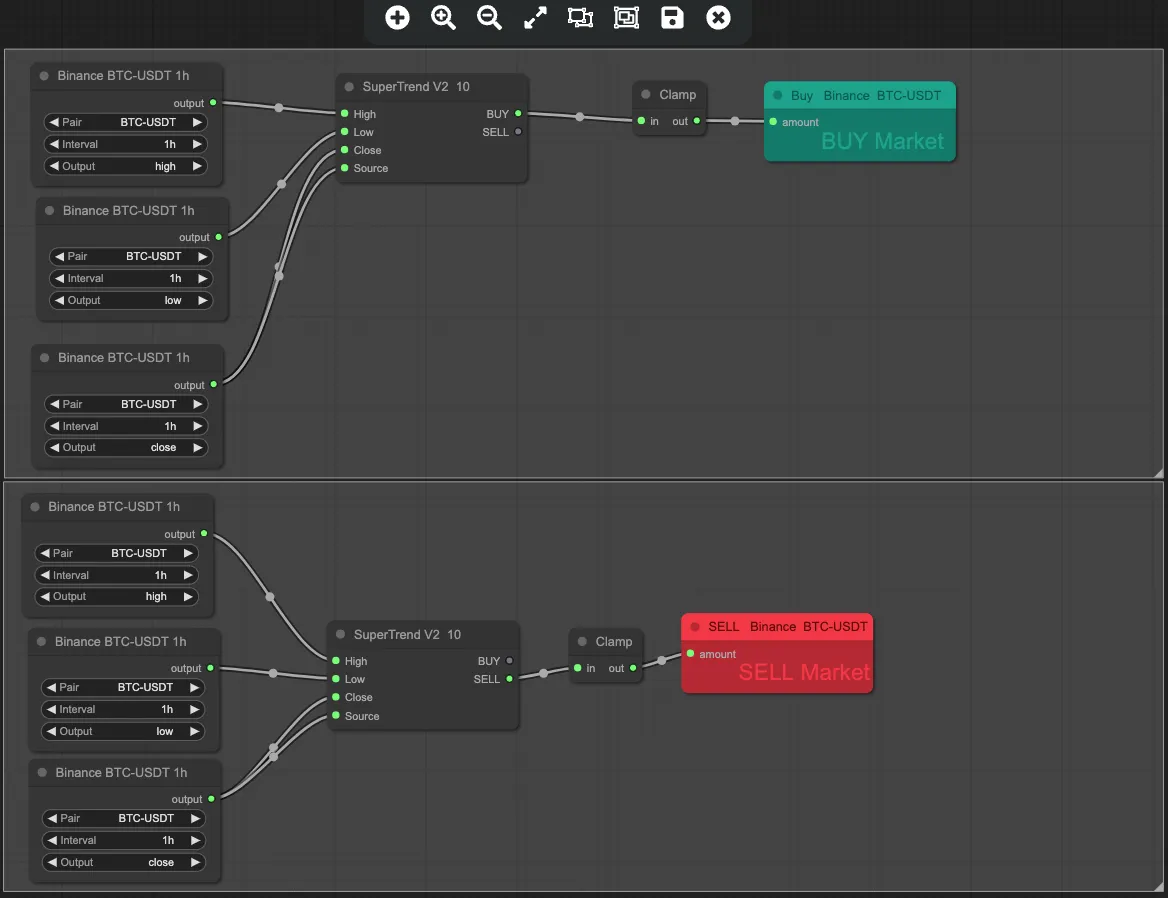
Change one setting on a SuperTrend KO strategy and the result can flip from a loss to a large gain. We saw exactly that on three years of crypto data. This post shows the rule, the results, and why robustness matters more than the best number.
The rules below are hypotheses to test, not a recommendation.
What Is SuperTrend KO?
SuperTrend KO is Arrow Algo’s version of the SuperTrend popularised by trader Kivanç Özbilgiç. The “KO” refers to his initials. It is a trend-following indicator that draws a line below price in an uptrend and above it in a downtrend.
The line sits a set distance from price. That distance is the Average True Range (ATR) times a multiplier. ATR measures typical candle movement. The line only moves in the trend’s direction, so it trails price like a stop.
When the close crosses the line, the trend flips. The block outputs a buy signal on a bullish flip and a sell signal on a bearish one. Our SuperTrend indicator guide covers the classic calculation in full. Our SuperTrend KO guide covers ways to use the block as a filter, and our SuperTrend trend following strategy builds the standard block into a full rule.
The Block’s Settings
The SuperTrend KO block has four choices that affect results:
- ATR period. How many candles the ATR averages. The block default is 14.
- ATR multiplier. How far the line sits from price. The block default is 2.
- ATR calculation. A simple average of candle ranges by default, or the smoothed standard ATR if switched on.
- Source. The price the line is measured from. The midpoint of each candle’s high and low is common. The close is another option.
The Rule We Tested
Use four-hour candles. Generate a long entry signal on a bullish flip. Exit on the next bearish flip. There is no separate stop, because the SuperTrend line already acts as one.
The control is a plain price rule. It buys when the close crosses above its 50-candle simple moving average (SMA) and exits when it crosses back below.
We tested on Binance four-hour candles from 10 November 2023 to 10 November 2026. We charged 0.1% per side and filled at the signal candle’s close. Indicators had six months of earlier data to warm up.
What Happened With the Default Settings?
| Market, 4-hour | Control: trades per year | Control: return | KO 14/2: trades per year | KO 14/2: return | KO 14/2: max drawdown | KO 14/2: win rate |
|---|---|---|---|---|---|---|
| BTC | 76 | -3.0% | 51 | +5.8% | 53.6% | 37% |
| ETH | 85 | -12.9% | 47 | +31.7% | 57.4% | 36% |
| SOL | 79 | -5.2% | 51 | -10.5% | 67.8% | 36% |
Hypothetical rule tests on past data, with no slippage. They are not trading results, and past behaviour may not repeat.
SuperTrend KO traded between a third and nearly half less than the control. It beat the control on BTC and ETH, but not SOL. Max drawdown, the largest peak-to-trough fall, topped 50% on every market. That is too deep for most real accounts.
Adding a Trend Filter
We then required the close to sit above the 200-period exponential moving average (EMA) before entering.
| Market, 4-hour | Control: return | Control: max drawdown | KO 14/2: return | KO 14/2: max drawdown |
|---|---|---|---|---|
| BTC | +20.0% | 36.8% | +21.9% | 42.5% |
| ETH | +72.5% | 39.9% | +126.3% | 31.8% |
| SOL | +48.7% | 44.8% | +10.3% | 58.7% |
Same assumptions as above.
The filter helped both rules. SuperTrend KO beat the control strongly on ETH, roughly tied on BTC, and lost clearly on SOL.
How Much Do the Settings Matter?
This is where the test got interesting. We changed one setting at a time, without the trend filter.
The Multiplier
| ATR multiplier | BTC return | ETH return | SOL return |
|---|---|---|---|
| 1.5 | +15.7% | -42.5% | +145.2% |
| 2 (default) | +5.8% | +31.7% | -10.5% |
| 3 | +25.4% | -6.4% | +58.4% |
| 4 | +4.6% | +23.9% | +290.4% |
Same assumptions as above. ATR period 14, candle midpoint as source.
There is no smooth pattern. ETH swings between gains and losses as the multiplier steps up. SOL ranges from a 10% loss to a 290% gain. A result that jumps around like this is mostly telling you about luck, not the setting.
The Source and the ATR Method
Switching the source from the candle midpoint to the close changed results just as much. BTC went from +5.8% to +26.6%. ETH went from +31.7% to -10.2%. SOL went from -10.5% to +57.6%.
Switching to the smoothed standard ATR had a smaller, steadier effect. It improved the result on all three markets, by 2 to 20 percentage points.
Why Is SuperTrend So Sensitive?
SuperTrend holds a position until one specific flip. A small change to the line can move a flip by a single candle. In a fast market, one candle can mean entering before or after a big move.
Those few big moves decide most of the result. Win rates were mostly between 30% and 40%. So shifting the timing of a handful of trades swings the total.
This is why picking the best setting from the table would be a mistake. SOL at a multiplier of 4 looks superb. It also sits next to a setting that lost money. Our post on the random entry test shows another way to check whether a result is more than luck.
Where Do SuperTrend KO Backtests Go Wrong?
Choosing the best cell in a table. Pick settings whose neighbours also work, or do not trade the rule.
Ignoring the source input. The source looks like a minor detail. In our tests, it changed results as much as the multiplier.
Testing one market. The default beat the control on ETH and lost on SOL. One market can tell either story.
Watch the Drawdowns
Trusting the trailing line as a stop. Without a trend filter, every version had drawdowns above 38%. The line trails price, but it can sit a long way below it after a volatile run.
Comparing against nothing. Always run a simple price rule beside it on the same data and fees.
Building the SuperTrend KO Strategy in Arrow Algo
The drag-and-drop visual builder expresses the rule as a short chain of visual blocks:
- Add the exchange’s candle data and select the four-hour timeframe.
- Connect the high, low, close and source inputs to a SuperTrend KO block. Set the ATR period, multiplier and ATR method.
- Join the block’s buy output with a flat-position check using an AND condition block.
- Connect the result to a buy action block. Under your rules, that block sends a signal.
- Connect the block’s sell output to a sell action block.
Add the 200 EMA as a further entry input for the trend-filtered version. Then duplicate the strategy several times, changing one setting in each copy. Run them all on the same data and fee settings, and compare them as a group.
No deployment is needed for any of this. If you later choose to deploy, your rules signal your own exchange account. The exchange decides whether to execute each order.
What Should You Take Into Your Own Test?
- A SuperTrend KO strategy buys on a bullish flip and exits on the next bearish flip.
- With default settings, it beat a 50 SMA control on BTC and ETH, but not SOL.
- Changing the multiplier or source swung results from losses to large gains, with no smooth pattern.
- The smoothed standard ATR gave a small, consistent improvement on all three markets.
- Judge the rule by its weakest neighbouring setting, not its best one.
Disclaimer: This content is for educational purposes only and does not constitute financial advice. Trading involves significant risk and you should only trade with capital you can afford to lose. Past performance is not indicative of future results. Always conduct your own research before making any trading decisions.
Ready to build your own automated trading strategies without writing a single line of code? Start for free at Arrow Algo and join thousands of traders who've made the switch to systematic trading.